IHOP 2014 Annual Report Download - page 56
Download and view the complete annual report
Please find page 56 of the 2014 IHOP annual report below. You can navigate through the pages in the report by either clicking on the pages listed below, or by using the keyword search tool below to find specific information within the annual report.-
 1
1 -
2
-
3
-
4
-
5
-
6
-
7
-
8
-
9
-
10
-
11
-
12
-
13
-
14
-
15
-
16
-
17
-
18
-
19
-
20
-
21
-
22
-
23
-
24
-
25
-
26
-
27
-
28
-
29
-
30
-
31
-
32
-
33
-
34
-
35
-
36
-
37
-
38
-
39
-
40
-
41
-
42
-
43
-
44
-
45
-
 46
46 -
 47
47 -
 48
48 -
 49
49 -
 50
50 -
 51
51 -
 52
52 -
 53
53 -
 54
54 -
 55
55 -
 56
56 -
 57
57 -
 58
58 -
 59
59 -
 60
60 -
 61
61 -
 62
62 -
 63
63 -
 64
64 -
 65
65 -
 66
66 -
67
-
68
-
69
-
70
-
71
-
72
-
73
-
74
-
75
-
76
-
77
-
78
-
79
-
80
-
81
-
82
-
83
-
84
-
85
-
86
-
87
-
88
-
89
-
90
-
91
-
92
-
93
-
94
-
95
-
96
-
97
-
98
-
99
-
100
-
101
-
102
-
103
-
104
-
105
-
106
-
107
-
108
-
109
-
110
-
111
-
112
-
113
-
114
-
115
-
116
-
117
-
118
-
119
-
120
-
121
-
122
-
123
-
124
-
125
-
126
-
127
-
128
-
129
-
130
-
131
 |
 |

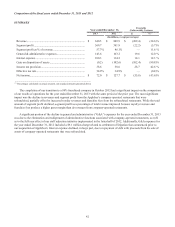
37
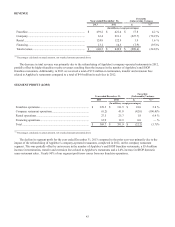
SEGMENT PROFIT (LOSS)
Year ended December 31,
Favorable
(Unfavorable) Variance
2014 2013 $%(1)
(In millions, except percentages)
Franchise operations......................................................... $ 334.3 $ 329.5 $ 4.8 1.5 %
Company restaurant operations........................................ (0.2)(0.2) 0.0 10.1 %
Rental operations.............................................................. 28.3 27.5 0.8 3.0 %
Financing operations ........................................................ 12.7 12.9 (0.2) (1.7)%
Total.................................................................................. $ 375.1 $ 369.7 $ 5.4 1.5 %
_____________________________________________________
(1) Percentages calculated on actual amounts, not rounded amounts presented above
The improvement in segment profit for the year ended December 31, 2014 compared to the prior year was primarily due to
a 3.9% increase in IHOP domestic franchise same-restaurant sales, an increase in the number of IHOP restaurants due to new
restaurant development by franchisees and a 1.1% increase in Applebee's domestic same-restaurant sales. These favorable
variances were partially offset by a decrease in Applebee's franchise termination, transfer and extension fees.
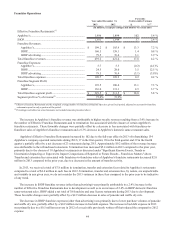
Franchise Operations
Year ended December 31,
Favorable
(Unfavorable) Variance
2014 2013 $%(2)
(In millions, except percentages and number of restaurants)
Effective Franchise Restaurants:(1)
Applebee’s............................................................................ 1,986 1,996 (10) (0.5)%
IHOP .................................................................................... 1,621 1,581 40 2.5 %
Franchise Revenues:
Applebee’s....................................................................... $ 195.6 $ 199.2 $ (3.6) (1.8)%
IHOP................................................................................ 170.2 160.5 9.7 6.1 %
IHOP advertising............................................................. 90.3 79.5 10.8 13.7 %
Total franchise revenues ...................................................... 456.1 439.2 16.9 3.9 %
Franchise Expenses:
Applebee’s....................................................................... 5.3 5.7 0.4 7.9 %
IHOP................................................................................ 26.2 24.5 (1.7) (7.0)%
IHOP advertising............................................................. 90.3 79.5 (10.8) (13.7)%
Total franchise expenses...................................................... 121.8 109.7 (12.1) (11.1)%
Franchise Segment Profit:
Applebee’s....................................................................... 190.3 193.5 (3.2) (1.6)%
IHOP................................................................................ 144.0 136.0 8.0 5.9 %
Total franchise segment profit ............................................. $ 334.3 $ 329.5 $ 4.8 1.5 %
Segment profit as % of revenue (2) 73.3% 75.0%
__________________________________________________________________________________________________
(1) Effective Franchise Restaurants are the weighted average number of franchise restaurants open in a given fiscal period, adjusted to account for franchise
restaurants open for only a portion of the period.
(2) Percentages calculated on actual amounts, not rounded amounts presented above.
The decline in Applebee’s franchise revenue was primarily attributable to a $7.1 million decrease in termination, transfer
and extension fees and a decrease in the number of Effective Franchise Restaurants open during the year. The impact on
franchise revenue of these declines was partially offset by a 1.1% increase in Applebee's domestic same-restaurant sales, a
higher effective royalty rate and an increase in franchise fees due to 10 more restaurant openings in 2014 than in 2013.