IHOP 2014 Annual Report Download - page 64
Download and view the complete annual report
Please find page 64 of the 2014 IHOP annual report below. You can navigate through the pages in the report by either clicking on the pages listed below, or by using the keyword search tool below to find specific information within the annual report.-
 1
1 -
2
-
3
-
4
-
5
-
6
-
7
-
8
-
9
-
10
-
11
-
12
-
13
-
14
-
15
-
16
-
17
-
18
-
19
-
20
-
21
-
22
-
23
-
24
-
25
-
26
-
27
-
28
-
29
-
30
-
31
-
32
-
33
-
34
-
35
-
36
-
37
-
38
-
39
-
40
-
41
-
42
-
43
-
44
-
45
-
46
-
47
-
48
-
49
-
50
-
51
-
52
-
53
-
 54
54 -
 55
55 -
 56
56 -
 57
57 -
 58
58 -
 59
59 -
 60
60 -
 61
61 -
 62
62 -
 63
63 -
 64
64 -
 65
65 -
 66
66 -
 67
67 -
 68
68 -
 69
69 -
 70
70 -
 71
71 -
 72
72 -
 73
73 -
 74
74 -
75
-
76
-
77
-
78
-
79
-
80
-
81
-
82
-
83
-
84
-
85
-
86
-
87
-
88
-
89
-
90
-
91
-
92
-
93
-
94
-
95
-
96
-
97
-
98
-
99
-
100
-
101
-
102
-
103
-
104
-
105
-
106
-
107
-
108
-
109
-
110
-
111
-
112
-
113
-
114
-
115
-
116
-
117
-
118
-
119
-
120
-
121
-
122
-
123
-
124
-
125
-
126
-
127
-
128
-
129
-
130
-
131
 |
 |

45
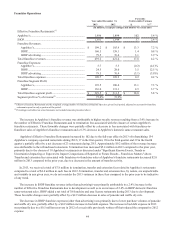
IHOP’s total franchise expenses are substantially higher than Applebee’s due to advertising expenses. Franchise fees
designated for IHOP’s national advertising fund and local marketing and advertising cooperatives are recognized as revenue
and expense of franchise operations. However, due to our having less contractual control over Applebee’s advertising
expenditures, that activity is considered to be an agency relationship and therefore is not recognized as franchise revenue and
expense. The increases in IHOP advertising revenue and expense in 2013 compared to the prior year were due to the increases
in Effective Franchise Restaurants and the increases in domestic franchise same-restaurant sales that also impacted IHOP
franchise revenue as noted above.
The increase in franchise segment profit for the year ended December 31, 2013 compared to the prior year was primarily
due to an increase in Applebee's Effective Franchise Restaurants because of the refranchising in 2012 of company-operated
restaurants, a net increase in franchise termination, transfer and extension fees, an increase in IHOP's Effective Franchise
Restaurants due to new restaurant development and an increase of 2.4% in IHOP domestic franchise same-restaurant sales.
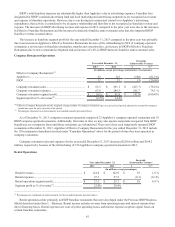
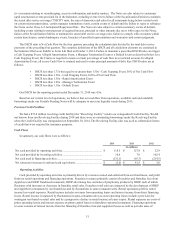
Company Restaurant Operations
Year ended December 31,
Favorable
(Unfavorable) Variance
2013 2012 $ %(2)
(In millions, except percentages and number of restaurants)
Effective Company Restaurants:(1)
Applebee’s............................................................................. 23 123 (100) (81.3)%
IHOP...................................................................................... 12 15 (3) (20.0)%
Company restaurant sales ...................................................... $ 63.5 $ 291.1 $ (227.7) (78.2)%
Company restaurant expenses ............................................... 63.6 249.3 185.7 74.5 %
Company restaurant segment profit....................................... $ (0.1) $ 41.8 $ (42.0) (100.4)%
Segment profit as % of revenue(2).......................................... (0.2)% 14.4%
____________________________________________________________
(1) Effective Company Restaurants are the weighted average number of company restaurants open in a given fiscal period, adjusted to account for company
restaurants open for only a portion of the period.
(2) Percentages calculated on actual amounts, not rounded amounts presented above.
As of December 31, 2013, company restaurant operations comprised 23 Applebee’s company-operated restaurants and 10
IHOP company-operated restaurants. Additionally, from time to time we may also operate restaurants reacquired from IHOP
franchisees on a temporary basis until those restaurants are refranchised. There were three such temporarily operated IHOP
restaurants at December 31, 2013. Applebee's Effective Company Restaurants for the year ended December 31, 2012 include
the 154 restaurants refranchised as noted under “Franchise Operations” above for the period of time they were operated as
company restaurants.
Company restaurant sales and expenses for the year ended December 31, 2013 decreased $224.0 million and $184.2
million, respectively, because of the refranchising of 154 Applebee's company-operated restaurants in 2012.
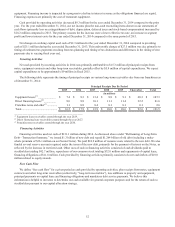
Rental Operations
Year ended December 31,
Favorable
(Unfavorable) Variance
2013 2012 $ %(2)
(In millions, except percentages)
Rental revenues ................................................................... $ 124.8 $ 122.9 $ 1.9 1.6 %
Rental expenses ................................................................... 97.3 97.2 (0.1) (0.1)%
Rental operations segment profit......................................... $ 27.5 $ 25.7 $ 1.8 6.9 %
Segment profit as % of revenue(1)........................................ 22.0% 20.9%
____________________________________________________________
(1) Percentages are calculated on actual amounts, not the rounded amounts presented above
Rental operations relate primarily to IHOP franchise restaurants that were developed under the Previous IHOP Business
Model described under Item 1. - Business. Rental income includes revenue from operating leases and interest income from
direct financing leases. Rental expenses are costs of prime operating leases and interest expense on prime capital leases on
certain franchise restaurants.