IHOP 2014 Annual Report Download - page 58
Download and view the complete annual report
Please find page 58 of the 2014 IHOP annual report below. You can navigate through the pages in the report by either clicking on the pages listed below, or by using the keyword search tool below to find specific information within the annual report.-
 1
1 -
2
-
3
-
4
-
5
-
6
-
7
-
8
-
9
-
10
-
11
-
12
-
13
-
14
-
15
-
16
-
17
-
18
-
19
-
20
-
21
-
22
-
23
-
24
-
25
-
26
-
27
-
28
-
29
-
30
-
31
-
32
-
33
-
34
-
35
-
36
-
37
-
38
-
39
-
40
-
41
-
42
-
43
-
44
-
45
-
46
-
47
-
 48
48 -
 49
49 -
 50
50 -
 51
51 -
 52
52 -
 53
53 -
 54
54 -
 55
55 -
 56
56 -
 57
57 -
 58
58 -
 59
59 -
 60
60 -
 61
61 -
 62
62 -
 63
63 -
 64
64 -
 65
65 -
 66
66 -
 67
67 -
 68
68 -
69
-
70
-
71
-
72
-
73
-
74
-
75
-
76
-
77
-
78
-
79
-
80
-
81
-
82
-
83
-
84
-
85
-
86
-
87
-
88
-
89
-
90
-
91
-
92
-
93
-
94
-
95
-
96
-
97
-
98
-
99
-
100
-
101
-
102
-
103
-
104
-
105
-
106
-
107
-
108
-
109
-
110
-
111
-
112
-
113
-
114
-
115
-
116
-
117
-
118
-
119
-
120
-
121
-
122
-
123
-
124
-
125
-
126
-
127
-
128
-
129
-
130
-
131
 |
 |

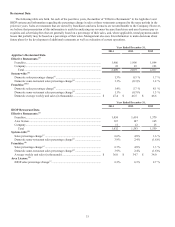
39
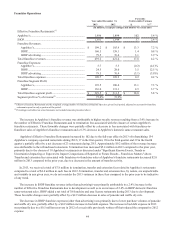
Rental Operations
Year ended December 31,
Favorable
(Unfavorable) Variance
2014 2013 $ %(1)
(In millions, except percentages)
Rental revenues ..................................................................... $ 122.9 $ 124.8 $ (1.9) (1.5)%
Rental expenses ..................................................................... 94.6 97.3 2.7 2.7 %
Rental operations segment profit........................................... $ 28.3 $ 27.5 $ 0.8 3.0 %
Segment profit as % of revenue (1) 23.0% 22.0%
_____________________________________________________
(1) Percentages calculated on actual amounts, not rounded amounts presented above
Rental operations relate primarily to IHOP franchise restaurants that were developed under the Previous IHOP Business
Model described under Item 1. - Business. Rental income includes revenue from operating leases and interest income from
direct financing leases. Rental expenses are costs of prime operating leases and interest expense on prime capital leases on
certain franchise restaurants.
Rental revenue for the year ended December 31, 2014 decreased primarily due to an increase in write-offs of deferred lease
revenue associated with franchise restaurants whose lease agreements were prematurely terminated and a decline in interest
income as direct financing leases are repaid. These unfavorable variances were partially offset by higher contingent rental
income resulting from an increase in IHOP domestic same-restaurant sales.
Rental expenses for the year ended December 31, 2014 decreased primarily due to a $1.0 million decline in interest on
capital lease obligations and lower operating costs of rental properties.
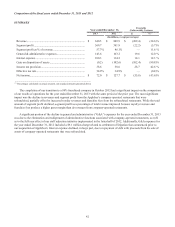
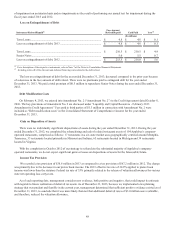
Financing Operations
Year ended December 31, Favorable
(Unfavorable) Variance
2014 2013 $ %(1)
(In millions, except percentages)
Financing revenues................................................................ $ 13.5 $ 13.1 $ 0.4 2.8 %
Financing expenses................................................................ 0.8 0.2 (0.6) (236.7)%
Financing operations segment profit ..................................... $ 12.7 $ 12.9 $ (0.2) (1.7)%
Segment profit as % of revenue (1) 93.9% 98.1%
_____________________________________________________
(1) Percentages calculated on actual amounts, not rounded amounts presented above
Financing operations relate primarily to IHOP franchise restaurants that were developed under the Previous IHOP Business
Model described under Item 1. - Business. Financing operations revenue primarily consists of interest income from the
financing of franchise fees and equipment leases. We also sell equipment associated with IHOP franchise restaurants we have
reacquired when those restaurants are subsequently refranchised to a new franchisee. Financing expenses are primarily the cost
of the restaurant equipment sold. Sales of equipment associated with reacquired IHOP restaurants are, by nature, unpredictable
and variable in any given year.
The increase in financing revenue for the year ended December 31, 2014 was primarily due to fees of $1.4 million
associated with the negotiated early termination of two leases. Early lease terminations such as these occur relatively
infrequently and should not be considered indicative of any trend with respect to financing segment revenue. The increase from
these termination fees was partially offset by a $0.8 million decrease in interest revenue resulting from the progressive decline
in note balances due to repayments.
The increase in financing expenses for the year ended December 31, 2014 was due to increased cost of sales of equipment
associated with reacquired IHOP restaurants that were refranchised during 2014.