IHOP 2014 Annual Report Download - page 62
Download and view the complete annual report
Please find page 62 of the 2014 IHOP annual report below. You can navigate through the pages in the report by either clicking on the pages listed below, or by using the keyword search tool below to find specific information within the annual report.-
 1
1 -
2
-
3
-
4
-
5
-
6
-
7
-
8
-
9
-
10
-
11
-
12
-
13
-
14
-
15
-
16
-
17
-
18
-
19
-
20
-
21
-
22
-
23
-
24
-
25
-
26
-
27
-
28
-
29
-
30
-
31
-
32
-
33
-
34
-
35
-
36
-
37
-
38
-
39
-
40
-
41
-
42
-
43
-
44
-
45
-
46
-
47
-
48
-
49
-
50
-
51
-
 52
52 -
 53
53 -
 54
54 -
 55
55 -
 56
56 -
 57
57 -
 58
58 -
 59
59 -
 60
60 -
 61
61 -
 62
62 -
 63
63 -
 64
64 -
 65
65 -
 66
66 -
 67
67 -
 68
68 -
 69
69 -
 70
70 -
 71
71 -
 72
72 -
73
-
74
-
75
-
76
-
77
-
78
-
79
-
80
-
81
-
82
-
83
-
84
-
85
-
86
-
87
-
88
-
89
-
90
-
91
-
92
-
93
-
94
-
95
-
96
-
97
-
98
-
99
-
100
-
101
-
102
-
103
-
104
-
105
-
106
-
107
-
108
-
109
-
110
-
111
-
112
-
113
-
114
-
115
-
116
-
117
-
118
-
119
-
120
-
121
-
122
-
123
-
124
-
125
-
126
-
127
-
128
-
129
-
130
-
131
 |
 |

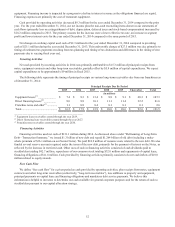
43
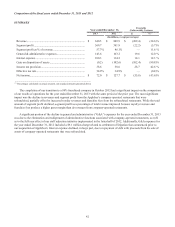
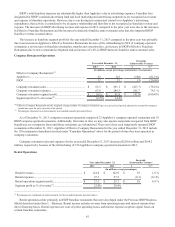
REVENUE
Year ended December 31, Favorable
(Unfavorable) Variance
2013 2012 $%(1)
(In millions, except percentages)
Franchise................................................................................ $ 439.2 $ 421.4 $ 17.8 4.2 %
Company................................................................................ 63.4 291.1 (227.7) (78.2)%
Rental..................................................................................... 124.8 122.9 1.9 1.6 %
Financing ............................................................................... 13.1 14.5 (1.4) (9.5)%
Total revenue ......................................................................... $ 640.5 $ 849.9 $ (209.4) (24.6)%
_____________________________________________________
(1) Percentages calculated on actual amounts, not rounded amounts presented above
The decrease in total revenue was primarily due to the refranchising of Applebee's company-operated restaurants in 2012,
partially offset by higher franchise royalty revenues resulting from the increase in the number of Applebee’s and IHOP
franchise restaurants. Additionally, in 2013 we received a total of $7.8 million in termination, transfer and extension fees
related to Applebee's restaurants compared to a total of $4.4 million in such fees in 2012.
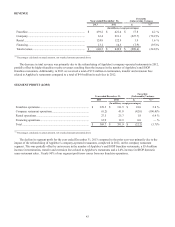
SEGMENT PROFIT (LOSS)
Year ended December 31,
Favorable
(Unfavorable) Variance
2013 2012 $%(1)
(In millions, except percentages)
Franchise operations .................................................................... $ 329.5 $ 311.5 $ 18.0 5.8 %
Company restaurant operations.................................................... (0.2) 41.8 (42.0) (100.4)%
Rental operations ......................................................................... 27.5 25.7 1.8 6.9 %
Financing operations.................................................................... 12.9 12.9 0.0 — %
Total ............................................................................................. $ 369.7 $ 391.9 $ (22.2) (5.7)%
_____________________________________________________
(1) Percentages calculated on actual amounts, not rounded amounts presented above
The decline in segment profit for the year ended December 31, 2013 compared to the prior year was primarily due to the
impact of the refranchising of Applebee’s company-operated restaurants, completed in 2012, on the company restaurant
segment. This was partially offset by an increase in the number of Applebee’s and IHOP franchise restaurants, a $3.4 million
increase in termination, transfer and extension fees related to Applebee's restaurants and a 2.4% increase in IHOP domestic
same-restaurant sales. Nearly 90% of our segment profit now comes from our franchise operations.