IHOP 2014 Annual Report Download - page 71
Download and view the complete annual report
Please find page 71 of the 2014 IHOP annual report below. You can navigate through the pages in the report by either clicking on the pages listed below, or by using the keyword search tool below to find specific information within the annual report.-
 1
1 -
2
-
3
-
4
-
5
-
6
-
7
-
8
-
9
-
10
-
11
-
12
-
13
-
14
-
15
-
16
-
17
-
18
-
19
-
20
-
21
-
22
-
23
-
24
-
25
-
26
-
27
-
28
-
29
-
30
-
31
-
32
-
33
-
34
-
35
-
36
-
37
-
38
-
39
-
40
-
41
-
42
-
43
-
44
-
45
-
46
-
47
-
48
-
49
-
50
-
51
-
52
-
53
-
54
-
55
-
56
-
57
-
58
-
59
-
60
-
 61
61 -
 62
62 -
 63
63 -
 64
64 -
 65
65 -
 66
66 -
 67
67 -
 68
68 -
 69
69 -
 70
70 -
 71
71 -
 72
72 -
 73
73 -
 74
74 -
 75
75 -
 76
76 -
 77
77 -
 78
78 -
 79
79 -
 80
80 -
 81
81 -
82
-
83
-
84
-
85
-
86
-
87
-
88
-
89
-
90
-
91
-
92
-
93
-
94
-
95
-
96
-
97
-
98
-
99
-
100
-
101
-
102
-
103
-
104
-
105
-
106
-
107
-
108
-
109
-
110
-
111
-
112
-
113
-
114
-
115
-
116
-
117
-
118
-
119
-
120
-
121
-
122
-
123
-
124
-
125
-
126
-
127
-
128
-
129
-
130
-
131
 |
 |

52
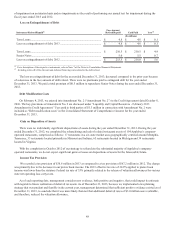
equipment. Financing income is impacted by a progressive decline in interest revenue as the obligations financed are repaid.
Financing expenses are primarily the cost of restaurant equipment.
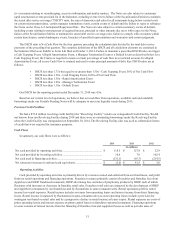
Cash provided by operating activities decreased $9.3 million for the year ended December 31, 2014 compared to the prior
year. For the year ended December 31, 2014, our net income plus the non-cash reconciling items shown in our statements of
cash flows (primarily loss on extinguishment of debt, depreciation, deferred taxes and stock-based compensation) increased by
$18.2 million compared to 2013. The primary reasons for the increase were a lower effective tax rate, an increase in segment
profit and lower interest costs for the year ended December 31, 2014 compared to the same period of 2013.
Net changes in working capital used cash of $2.3 million for the year ended December 31, 2014 compared to providing
cash of $25.1 million during the year ended December 31, 2013. This unfavorable change of $27.5 million was due primarily to
timing of estimated tax payments resulting from tax planning and timing of tax deductions and differences in the timing of rent
payments due to varying fiscal year end.
Investing Activities
Net cash provided by investing activities in 2014 was primarily attributable to $15.3 million of principal receipts from
notes, equipment contracts and other long-term receivables, partially offset by $5.9 million of capital expenditures. We expect
capital expenditures to be approximately $9 million in fiscal 2015.
The following table represents the timing of principal receipts on various long-term receivables due from our franchisees as
of December 31, 2014:
Principal Receipts Due By Period
2015 2016 2017 2018 2019 Thereafter Total
(In millions)
Equipment leases(1) ........................ $ 7.4 $ 8.3 $ 13.4 $ 8.8 $ 9.1 $ 60.3 $ 107.3
Direct financing leases(2)................. 8.0 8.8 10.1 11.1 11.4 32.2 81.6
Franchise notes and other(3) .............. 1.1 0.8 0.4 0.1 0.1 0.1 2.6
Total.................................................. $ 16.5 $ 17.9 $ 23.9 $ 20.0 $ 20.6 $ 92.6 $ 191.5
________________________________________________
(1) Equipment lease receivables extend through the year 2029.
(2) Direct financing lease receivables extend through the year 2027.
(3) Franchise note receivables extend through the year 2020.
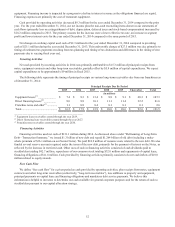
Financing Activities
Financing activities used net cash of $131.1 million during 2014. As discussed above under “Refinancing of Long-Term
Debt - Transaction Summary,” we issued $1.3 billion of new debt and repaid $1.264 billion of old debt (including a make-
whole premium of $36.1 million on our Senior Notes). We paid $24.2 million of issuance costs related to the new debt. We also
funded several reserve accounts required under the terms of the new debt, primarily for the payment of interest on the Notes, as
reflected by the increase in restricted cash. Other uses of cash in financing activities consisted of cash dividends paid to
stockholders totaling $42.7 million, repurchases of our common stock totaling $32.0 million and repayments of capital lease,
financing obligations of $11.8 million. Cash provided by financing activities primarily consisted of a net cash inflow of $10.0
million related to equity awards.
Free Cash Flow
We define “free cash flow” for a given period as cash provided by operating activities, plus receipts from notes, equipment
contracts and other long-term receivables (collectively, “long-term receivables”), less additions to property and equipment,
principal payments on capital lease and financing obligations and mandatory debt service payments. We believe this
information is helpful to investors to determine our cash available for general corporate purposes and for the return of cash to
stockholders pursuant to our capital allocation strategy.