IHOP 2014 Annual Report Download - page 55
Download and view the complete annual report
Please find page 55 of the 2014 IHOP annual report below. You can navigate through the pages in the report by either clicking on the pages listed below, or by using the keyword search tool below to find specific information within the annual report.-
 1
1 -
2
-
3
-
4
-
5
-
6
-
7
-
8
-
9
-
10
-
11
-
12
-
13
-
14
-
15
-
16
-
17
-
18
-
19
-
20
-
21
-
22
-
23
-
24
-
25
-
26
-
27
-
28
-
29
-
30
-
31
-
32
-
33
-
34
-
35
-
36
-
37
-
38
-
39
-
40
-
41
-
42
-
43
-
44
-
 45
45 -
 46
46 -
 47
47 -
 48
48 -
 49
49 -
 50
50 -
 51
51 -
 52
52 -
 53
53 -
 54
54 -
 55
55 -
 56
56 -
 57
57 -
 58
58 -
 59
59 -
 60
60 -
 61
61 -
 62
62 -
 63
63 -
 64
64 -
 65
65 -
66
-
67
-
68
-
69
-
70
-
71
-
72
-
73
-
74
-
75
-
76
-
77
-
78
-
79
-
80
-
81
-
82
-
83
-
84
-
85
-
86
-
87
-
88
-
89
-
90
-
91
-
92
-
93
-
94
-
95
-
96
-
97
-
98
-
99
-
100
-
101
-
102
-
103
-
104
-
105
-
106
-
107
-
108
-
109
-
110
-
111
-
112
-
113
-
114
-
115
-
116
-
117
-
118
-
119
-
120
-
121
-
122
-
123
-
124
-
125
-
126
-
127
-
128
-
129
-
130
-
131
 |
 |

36
Comparison of the fiscal years ended December 31, 2014 and 2013
SUMMARY
Year ended December 31, Favorable
(Unfavorable) Variance
2014 2013 $ %(1)
(In millions, except percentages)
Revenue ................................................................................. $ 655.0 $ 640.5 $ 14.5 2.3 %
Segment profit ....................................................................... 375.1 369.7 5.4 1.5 %
Segment profit as % of revenue............................................. 57.3% 57.7% — (0.4)%
General & administrative expenses ....................................... 145.9 143.6 (2.3) (1.6)%
Interest expense ..................................................................... 96.6 100.3 3.6 3.6 %
Loss on extinguishment of debt............................................. 64.9 0.1 (64.8) n.m
Income tax provision ............................................................. 15.1 38.6 23.4 60.7 %
Effective tax rate.................................................................... 29.3% 34.9% — 5.6 %
Net income............................................................................. $ 36.5 $ 72.0 $ (35.5) (49.4)%
_____________________________________________________
(1) Percentages calculated on actual amounts, not rounded amounts presented above
n.m. - not meaningful
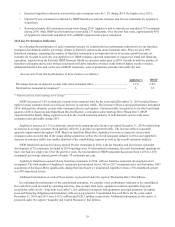
The refinancing of our long-term debt had a significant impact on the comparison of our results of operations for the year
ended December 31, 2014 with the same period of the prior year. We recognized a loss on debt extinguishment of $64.9
million, comprised of the $36.1 million make-whole premium on the Senior Notes and the write-off of unamortized debt
discount and issuance costs associated with the extinguished debt of $16.9 million and $11.9 million, respectively. As a result
of the refinancing, our interest expense was nearly $4 million lower than in the prior year (see “Other Expense and Income
Items - Interest Expense”). We expect our annual cash interest expense on the new long-term debt will be approximately $34
million lower than it had been on the old long-term debt.
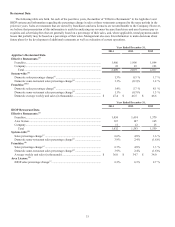
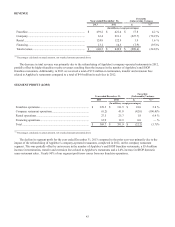
REVENUE
Year ended December 31, Favorable
(Unfavorable) Variance
2014 2013 $ %(1)
(In millions, except percentages)
Franchise................................................................................ $ 456.1 $ 439.2 $ 16.9 3.9 %
Company................................................................................ 62.5 63.4 (0.9) (1.6)%
Rental..................................................................................... 122.9 124.8 (1.9) (1.5)%
Financing ............................................................................... 13.5 13.1 0.4 2.8 %
Total revenue ......................................................................... $ 655.0 $ 640.5 $ 14.5 2.3 %
_____________________________________________________
(1) Percentages calculated on actual amounts, not rounded amounts presented above
The increase in total revenue was primarily due to an increase in contributions to the IHOP NAF by the large majority of
IHOP franchisees, a 3.9% increase in IHOP domestic franchise same-restaurant sales, an increase in the number of IHOP
restaurants due to new restaurant development by franchisees and a 1.1% increase in Applebee's domestic same-restaurant
sales. These favorable variances were partially offset by a decrease in Applebee's franchise termination, transfer and extension
fees. In 2014, we received a total of $0.7 million in termination, transfer and extension fees related to Applebee's restaurants
compared to a total of $7.8 million in such fees in 2013. We believe the amount of these fees received in 2013 was atypically
high.