IHOP 2014 Annual Report Download - page 7
Download and view the complete annual report
Please find page 7 of the 2014 IHOP annual report below. You can navigate through the pages in the report by either clicking on the pages listed below, or by using the keyword search tool below to find specific information within the annual report.-
 1
1 -
 2
2 -
 3
3 -
 4
4 -
 5
5 -
 6
6 -
 7
7 -
 8
8 -
 9
9 -
 10
10 -
 11
11 -
 12
12 -
 13
13 -
 14
14 -
 15
15 -
 16
16 -
 17
17 -
 18
18 -
19
-
20
-
21
-
22
-
23
-
24
-
25
-
26
-
27
-
28
-
29
-
30
-
31
-
32
-
33
-
34
-
35
-
36
-
37
-
38
-
39
-
40
-
41
-
42
-
43
-
44
-
45
-
46
-
47
-
48
-
49
-
50
-
51
-
52
-
53
-
54
-
55
-
56
-
57
-
58
-
59
-
60
-
61
-
62
-
63
-
64
-
65
-
66
-
67
-
68
-
69
-
70
-
71
-
72
-
73
-
74
-
75
-
76
-
77
-
78
-
79
-
80
-
81
-
82
-
83
-
84
-
85
-
86
-
87
-
88
-
89
-
90
-
91
-
92
-
93
-
94
-
95
-
96
-
97
-
98
-
99
-
100
-
101
-
102
-
103
-
104
-
105
-
106
-
107
-
108
-
109
-
110
-
111
-
112
-
113
-
114
-
115
-
116
-
117
-
118
-
119
-
120
-
121
-
122
-
123
-
124
-
125
-
126
-
127
-
128
-
129
-
130
-
131
 |
 |
satisfaction with DineEquity’s brand management
and support services. While franchisees are initially
attracted by our leading brands, they stay because
of their confidence in the strength of talent that
DineEquity is able to apply to the leadership teams
at both brands. Many franchisees have shared that
the experience of working with DineEquity is very
open and transparent, and they enjoy easy access to
leadership. We are proud to work with an extremely
successful, sophisticated and business-savvy group
of franchisees, and we consider the level of support,
collaboration and buy-in that we receive from them
to be a key differentiator for our company. We are
continuing to enhance the collaboration process
with franchisees, so that the Applebee’s® and IHOP®
brands can benefit from the experience and thought
leadership of this distinguished group.
Looking forward
At DineEquity, we have established a reputation as a
company with a proven competency at building and
differentiating strong brands. In the future, we will
prudently evaluate the ways in which this competency
can create opportunities for DineEquity to grow our
footprint and expand into new markets.
I would like to express my sincere thanks to my
executive team, our Board of Directors, team
members, franchisees, the purchasing cooperative,
vendor partners, and to you, our shareholders, for
your continued support.
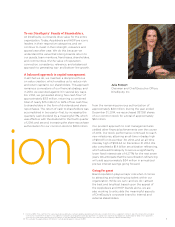
Julia A. Stewart
Chairman and Chief Executive Officer
DineEquity, Inc.
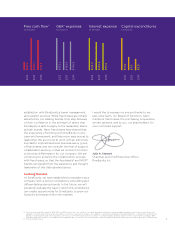
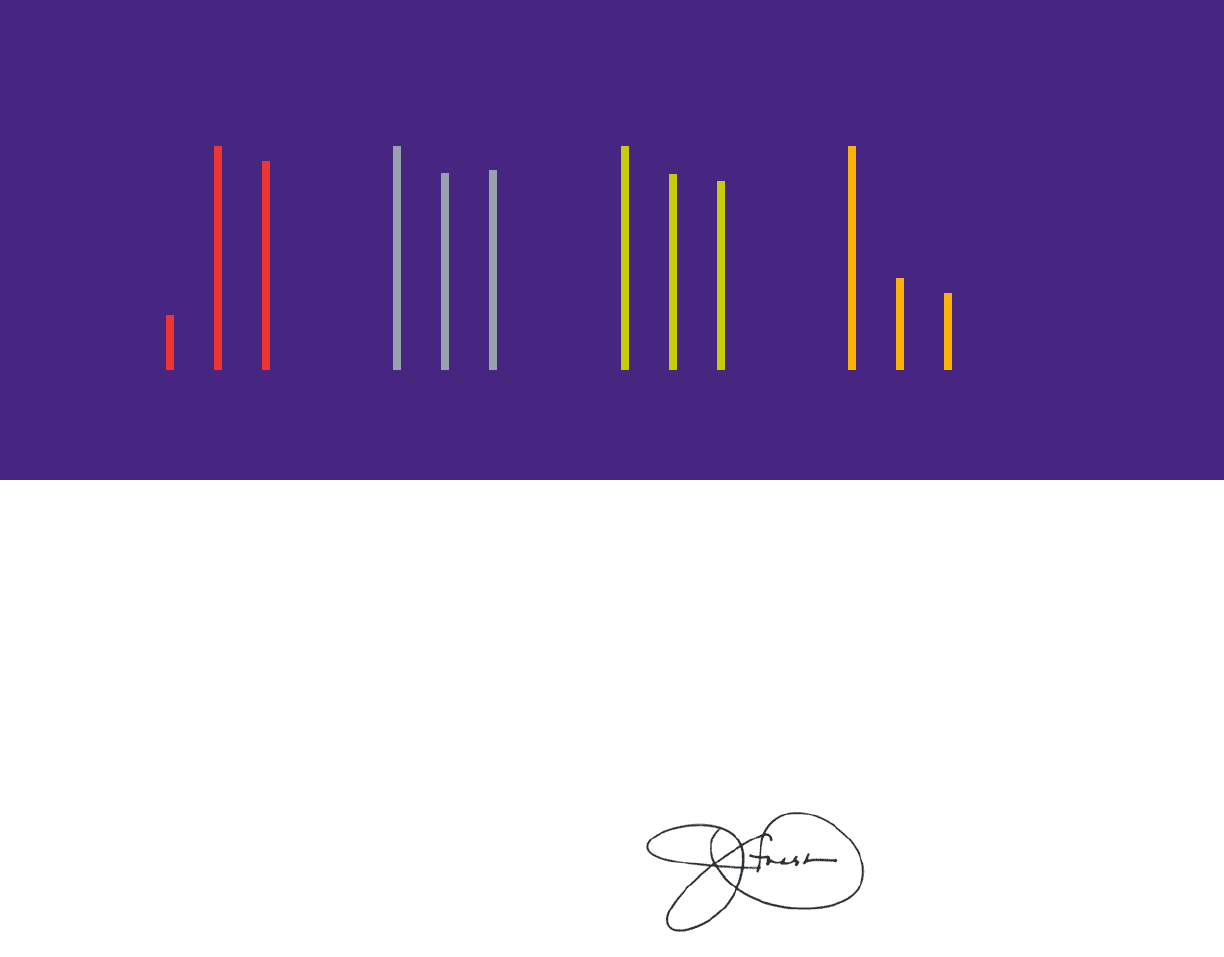
12 For fiscal years ended December 31, 2012, 2013, and 2014, respectively, “Free cash flow” for a given period was defined as cash provided by operating activities, plus receipts from notes,
equipment contracts and other long-term receivables (collectively, “long-term receivables”), less additions to property and equipment, principal payments on capital lease and financing
obligations and mandatory debt service payments. (See non-U.S. GAAP financial measure reconciliation of cash provided by operating activities to free cash flow in the Company’s 2014
Form 10-K filing.) Free cash flow in fiscal 2012 was lower primarily due to the increase in cash taxes paid on refranchising proceeds and, as expected, lower segment profit due to refranchising.
13 General & Administrative.
Free cash flow12
(in millions)
2012 $29.9
2013 $120.1
2014 $112.5
G&A13 expenses
(in millions)
2012 $163.2
2013 $143.6
2014 $145.9
Interest expense
(in millions)
2012 $114.3
2013 $100.3
2014 $96.6
2012 $17.0
2013 $7.0
2014 $5.9
Capital expenditures
(in millions)
5