IHOP 2014 Annual Report Download - page 48
Download and view the complete annual report
Please find page 48 of the 2014 IHOP annual report below. You can navigate through the pages in the report by either clicking on the pages listed below, or by using the keyword search tool below to find specific information within the annual report.-
 1
1 -
2
-
3
-
4
-
5
-
6
-
7
-
8
-
9
-
10
-
11
-
12
-
13
-
14
-
15
-
16
-
17
-
18
-
19
-
20
-
21
-
22
-
23
-
24
-
25
-
26
-
27
-
28
-
29
-
30
-
31
-
32
-
33
-
34
-
35
-
36
-
37
-
 38
38 -
 39
39 -
 40
40 -
 41
41 -
 42
42 -
 43
43 -
 44
44 -
 45
45 -
 46
46 -
 47
47 -
 48
48 -
 49
49 -
 50
50 -
 51
51 -
 52
52 -
 53
53 -
 54
54 -
 55
55 -
 56
56 -
 57
57 -
 58
58 -
59
-
60
-
61
-
62
-
63
-
64
-
65
-
66
-
67
-
68
-
69
-
70
-
71
-
72
-
73
-
74
-
75
-
76
-
77
-
78
-
79
-
80
-
81
-
82
-
83
-
84
-
85
-
86
-
87
-
88
-
89
-
90
-
91
-
92
-
93
-
94
-
95
-
96
-
97
-
98
-
99
-
100
-
101
-
102
-
103
-
104
-
105
-
106
-
107
-
108
-
109
-
110
-
111
-
112
-
113
-
114
-
115
-
116
-
117
-
118
-
119
-
120
-
121
-
122
-
123
-
124
-
125
-
126
-
127
-
128
-
129
-
130
-
131
 |
 |

29
• Increased Applebee's domestic system-wide same-restaurant sales by 1.1% during 2014, the highest since 2012;
• Opened 56 new restaurants worldwide by IHOP franchisees and area licensees and 36 new restaurants by Applebee's
franchisees;
• Remodeled nearly 500 restaurants system-wide during 2014. Applebee's and its franchisees remodeled 357 restaurants
during 2014, while IHOP and its franchisees remodeled 137 restaurants. Over the past four years, approximately 90%
of Applebee's restaurants and almost 50% of IHOP restaurants have been remodeled.
2014 Key Performance Indicators
In evaluating the performance of each restaurant concept, we consider the key performance indicators to be net franchise
restaurant development and the percentage change in domestic system-wide same-restaurant sales. Since we are a 99%
franchised company, expanding the number of franchise restaurants is an important driver of revenue growth because we
currently do not plan to open any new Applebee's or IHOP company-operated restaurants or expand our rental and financing
operations, legacies from the Previous IHOP Business Model we operated under prior to 2003. Growth in both the number of
franchise restaurants and in sales at those restaurants will drive franchise revenues in the form of higher royalty revenues,
additional franchise fees and, in the case of IHOP restaurants, sales of proprietary pancake and waffle dry mix.
An overview of our 2014 performance in these metrics is as follows:
Applebee's IHOP
Percentage increase in domestic system-wide same-restaurant sales................................................ 1.1% 3.9%
Net franchise restaurant development(1) ............................................................................................. 6 32
_____________________________________________________
(1) Franchise and area license openings, net of closings
IHOP's increase of 3.9% in domestic system-wide restaurant sales for the year ended December 31, 2014 resulted from a
higher average customer check as well as an increase in customer traffic. The increase reflects a strong performance throughout
2014, with positive domestic system-wide restaurant sales in each quarter. Customer traffic was positive in the third and fourth
quarters of 2014. Based on data from Black Box Intelligence, a restaurant sales reporting firm (“Black Box”), IHOP
outperformed the family dining segment as well as the overall restaurant industry in both domestic system-wide same-
restaurant sales and traffic during 2014.
Applebee's increase of 1.1% in domestic system-wide restaurant sales for the year ended December 31, 2014 resulted from
an increase in average customer check partially offset by a decrease in customer traffic. The increase reflects sequential
quarterly improvement throughout 2014. Based on data from Black Box, Applebee's increase in domestic system-wide
restaurant sales exceeded that of the casual dining segment as well as the overall restaurant industry in 2014, and Applebee's
decrease in customer traffic was smaller than that of the casual dining segment as well as the overall restaurant industry.
IHOP franchisees and area licensees opened 56 new restaurants in 2014, with net franchise and area license restaurant
development of 32 restaurants. Included in 2014 openings were 18 international restaurants, the most international openings we
have ever had in a single year. Over the past five years, the total number of IHOP restaurants has grown from 1,456 to 1,650
restaurants, an average annual growth of nearly 39 restaurants per year.
Applebee's franchisees opened 36 new franchise restaurants in 2014, with net franchise restaurant development of six
restaurants. The total number of Applebee's restaurants has increased from 1,965 to 2,017 restaurants since our November, 2007
acquisition of the brand. More significantly, during that time frame we transitioned Applebee's from a 72% franchised system
to a 99% franchised system.
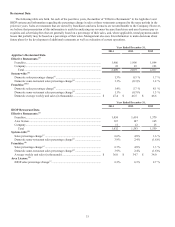
Additional information on each of these metrics is presented under the caption “Restaurant Data” that follows.
In evaluating the performance of the consolidated enterprise, we consider a key performance indicator to be consolidated
free cash flow (cash provided by operating activities, plus receipts from notes, equipment contracts and other long-term
receivables (collectively, “long-term receivables”), less additions to property and equipment, principal payments on capital
lease and financing obligations and mandatory debt service payments). Consolidated free cash flows for the years ended
December 31, 2014 and 2013 were $112.5 million and $120.1 million, respectively. Additional information on this metric is
presented under the caption “Liquidity and Capital Resources” that follows.