IHOP 2014 Annual Report Download - page 51
Download and view the complete annual report
Please find page 51 of the 2014 IHOP annual report below. You can navigate through the pages in the report by either clicking on the pages listed below, or by using the keyword search tool below to find specific information within the annual report.-
 1
1 -
2
-
3
-
4
-
5
-
6
-
7
-
8
-
9
-
10
-
11
-
12
-
13
-
14
-
15
-
16
-
17
-
18
-
19
-
20
-
21
-
22
-
23
-
24
-
25
-
26
-
27
-
28
-
29
-
30
-
31
-
32
-
33
-
34
-
35
-
36
-
37
-
38
-
39
-
40
-
 41
41 -
 42
42 -
 43
43 -
 44
44 -
 45
45 -
 46
46 -
 47
47 -
 48
48 -
 49
49 -
 50
50 -
 51
51 -
 52
52 -
 53
53 -
 54
54 -
 55
55 -
 56
56 -
 57
57 -
 58
58 -
 59
59 -
 60
60 -
 61
61 -
62
-
63
-
64
-
65
-
66
-
67
-
68
-
69
-
70
-
71
-
72
-
73
-
74
-
75
-
76
-
77
-
78
-
79
-
80
-
81
-
82
-
83
-
84
-
85
-
86
-
87
-
88
-
89
-
90
-
91
-
92
-
93
-
94
-
95
-
96
-
97
-
98
-
99
-
100
-
101
-
102
-
103
-
104
-
105
-
106
-
107
-
108
-
109
-
110
-
111
-
112
-
113
-
114
-
115
-
116
-
117
-
118
-
119
-
120
-
121
-
122
-
123
-
124
-
125
-
126
-
127
-
128
-
129
-
130
-
131
 |
 |

32
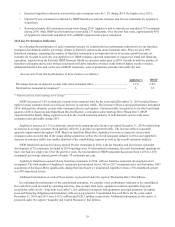
Advertising Contributions to IHOP National Advertising Fund
During 2014, the Company and franchisees whose restaurants contribute a large majority of total annual contributions to
the IHOP National Advertising Fund (the “IHOP NAF”) entered into an amendment to their franchise agreements that
increased the advertising contribution percentage of those restaurants' gross sales. Pursuant to the amendment, for the period
from June 30, 2014 to December 31, 2014, 2.74% of each participating restaurant's gross sales was contributed to the IHOP
NAF and 0.76% was contributed to local advertising cooperatives. For the period from January 1, 2015 to December 31, 2017,
3.50% of each participating restaurant's gross sales will be contributed to the IHOP NAF with no significant contribution to
local advertising cooperatives. The amended advertising contribution percentage is also applicable to IHOP company-operated
restaurants.
Same-restaurant Traffic
The IHOP increase in customer traffic for the year ended December 31, 2014 was the first such increase in eight years.
Prior to that, both of our brands have generally experienced a decline in customer traffic in recent years, including a decrease in
Applebee's customer traffic for the year ended December 31, 2014. Based on data from Black Box, customer traffic declined in
2014 for the restaurant industry overall and the casual dining segment of the restaurant industry, while customer traffic
increased slightly for the family dining segment. In the short term, a decline in customer traffic may be offset by an increase in
average customer check resulting from an increase in menu prices, a favorable change in product sales mix, or a combination
thereof. A sustained decline in same-restaurant customer traffic that cannot be offset by an increase in average customer check
could have an adverse effect on our business, results of operations and financial condition. We continue to evaluate and assess
opportunities to drive same-restaurant sales and traffic at both our brands. However, in the highly competitive restaurant
industry, there can be no assurance that our efforts will achieve the intended results within the time frame anticipated.
Interest Expense
As discussed under “Liquidity and Capital Resources - Refinancing of Long-Term Debt,” during 2014 we refinanced
$1.225 billion principal amount of existing long-term debt that bore interest at a weighted average interest rate of
approximately 7.3% with $1.3 billion principal amount of new long-term debt bearing interest at a fixed rate of 4.277%. As a
result, we expect our annual cash interest expense on long-term debt will be approximately $34 million lower than it had been
prior to the refinancing.
2015 Fiscal Year
Our fiscal year ends on the Sunday nearest to December 31 of each year. As a result, every five or six years, a fiscal year
will contain 53 weeks. Our 2015 fiscal year will contain 53 weeks. In a 52-week fiscal year, each fiscal quarter contains 13
weeks, comprised of two, four-week fiscal months followed by a five-week fiscal month. In a 53-week fiscal year, the last
month of the fourth fiscal quarter contains six weeks.