IHOP 2014 Annual Report Download - page 57
Download and view the complete annual report
Please find page 57 of the 2014 IHOP annual report below. You can navigate through the pages in the report by either clicking on the pages listed below, or by using the keyword search tool below to find specific information within the annual report.-
 1
1 -
2
-
3
-
4
-
5
-
6
-
7
-
8
-
9
-
10
-
11
-
12
-
13
-
14
-
15
-
16
-
17
-
18
-
19
-
20
-
21
-
22
-
23
-
24
-
25
-
26
-
27
-
28
-
29
-
30
-
31
-
32
-
33
-
34
-
35
-
36
-
37
-
38
-
39
-
40
-
41
-
42
-
43
-
44
-
45
-
46
-
 47
47 -
 48
48 -
 49
49 -
 50
50 -
 51
51 -
 52
52 -
 53
53 -
 54
54 -
 55
55 -
 56
56 -
 57
57 -
 58
58 -
 59
59 -
 60
60 -
 61
61 -
 62
62 -
 63
63 -
 64
64 -
 65
65 -
 66
66 -
 67
67 -
68
-
69
-
70
-
71
-
72
-
73
-
74
-
75
-
76
-
77
-
78
-
79
-
80
-
81
-
82
-
83
-
84
-
85
-
86
-
87
-
88
-
89
-
90
-
91
-
92
-
93
-
94
-
95
-
96
-
97
-
98
-
99
-
100
-
101
-
102
-
103
-
104
-
105
-
106
-
107
-
108
-
109
-
110
-
111
-
112
-
113
-
114
-
115
-
116
-
117
-
118
-
119
-
120
-
121
-
122
-
123
-
124
-
125
-
126
-
127
-
128
-
129
-
130
-
131
 |
 |

38
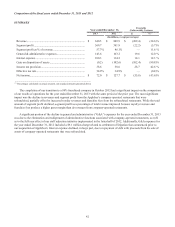
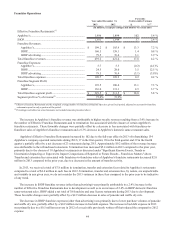
In 2014, we received a total of $0.7 million in termination, transfer and extension fees related to Applebee's restaurants
compared to a total of $7.8 million in such fees in 2013. The amount of fees received in 2013 was atypically high, primarily
due to a bankruptcy proceeding involving a franchisee that owned and operated 33 Applebee's restaurants, 18 of which were
ultimately closed and 15 of which were sold to another franchisee. The receipt of termination, transfer and extension fees is
unpredictable and may vary significantly from year to year.
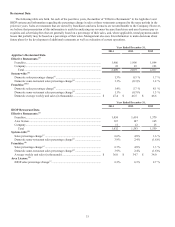
The increase in IHOP franchise revenue (other than advertising) was primarily attributable to higher royalty revenue
resulting from an increase of 3.9% in IHOP domestic franchise same-restaurant sales and a 2.5% increase in the number of
Effective Franchise Restaurants due to development, as well as a $1.7 million increase in sales of pancake and waffle dry mix.
IHOP added a net total of 32 franchise and area license restaurants during 2014 due to development.
The increase in IHOP franchise expenses (other than advertising) was primarily due to higher purchases of pancake and
waffle dry mix and increases in other franchise operating costs. These unfavorable variances were partially offset by lower bad
debt expense.
IHOP’s total franchise expenses are substantially higher than Applebee’s due to advertising expenses. Franchise fees
designated for the IHOP NAF and local marketing and advertising cooperatives are recognized as revenue and expense of
franchise operations. However, due to our having less contractual control over Applebee’s advertising expenditures, that
activity is considered to be an agency relationship and therefore is not recognized as franchise revenue and expense.
Approximately $5.9 million of the increases in IHOP advertising revenue and expenses in 2014 compared to the prior year
were due to the increased contributions to the IHOP NAF by the large majority of IHOP franchisees as discussed under
“Significant Known Events, Trends or Uncertainties Impacting or Expected to Impact Comparisons of Reported or Future
Results - Advertising Contributions to IHOP National Advertising Fund.” Approximately $4.9 million of the increases were due
to the increases in domestic franchise same-restaurant sales and Effective Franchise Restaurants that also impacted IHOP
franchise revenue.
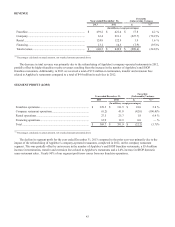
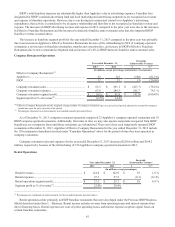
Company Restaurant Operations
Year ended December 31,
Favorable
(Unfavorable) Variance
2014 2013 $%(2)
(In millions, except percentages and number of restaurants)
Effective Company Restaurants:(1)
Applebee’s............................................................................. 23 23 — — %
IHOP...................................................................................... 11 12 (1) (8.3)%
Company restaurant sales ...................................................... $ 62.5 $ 63.4 $ (0.9) (1.6)%
Company restaurant expenses ............................................... 62.7 63.6 0.9 1.5 %
Company restaurant segment profit....................................... $ (0.2) $ (0.2) $ 0.0 10.1 %
Segment profit as % of revenue (2) (0.3)% (0.2)%
_____________________________________________________
(1) Effective Company Restaurants are the weighted average number of company restaurants open in a given fiscal period, adjusted to account for company
restaurants open for only a portion of the period.
(2) Percentages calculated on actual amounts, not rounded amounts presented above.
As of December 31, 2014, company restaurant operations comprised 23 Applebee’s company-operated restaurants and 10
IHOP company-operated restaurants. We expect to refranchise the Applebee's company-operated restaurants within the next
twelve months, although there can be no guarantee a transaction will take place within that time frame, if at all. Additionally,
from time to time we may also operate restaurants reacquired from IHOP franchisees on a temporary basis until those
restaurants are refranchised. There was one such temporarily operated IHOP restaurant at December 31, 2014. Company
restaurant sales and expenses for the year ended December 31, 2014 declined compared to the prior year primarily because we
operated fewer such reacquired restaurants during 2014.