IHOP 2014 Annual Report Download - page 70
Download and view the complete annual report
Please find page 70 of the 2014 IHOP annual report below. You can navigate through the pages in the report by either clicking on the pages listed below, or by using the keyword search tool below to find specific information within the annual report.-
 1
1 -
2
-
3
-
4
-
5
-
6
-
7
-
8
-
9
-
10
-
11
-
12
-
13
-
14
-
15
-
16
-
17
-
18
-
19
-
20
-
21
-
22
-
23
-
24
-
25
-
26
-
27
-
28
-
29
-
30
-
31
-
32
-
33
-
34
-
35
-
36
-
37
-
38
-
39
-
40
-
41
-
42
-
43
-
44
-
45
-
46
-
47
-
48
-
49
-
50
-
51
-
52
-
53
-
54
-
55
-
56
-
57
-
58
-
59
-
 60
60 -
 61
61 -
 62
62 -
 63
63 -
 64
64 -
 65
65 -
 66
66 -
 67
67 -
 68
68 -
 69
69 -
 70
70 -
 71
71 -
 72
72 -
 73
73 -
 74
74 -
 75
75 -
 76
76 -
 77
77 -
 78
78 -
 79
79 -
 80
80 -
81
-
82
-
83
-
84
-
85
-
86
-
87
-
88
-
89
-
90
-
91
-
92
-
93
-
94
-
95
-
96
-
97
-
98
-
99
-
100
-
101
-
102
-
103
-
104
-
105
-
106
-
107
-
108
-
109
-
110
-
111
-
112
-
113
-
114
-
115
-
116
-
117
-
118
-
119
-
120
-
121
-
122
-
123
-
124
-
125
-
126
-
127
-
128
-
129
-
130
-
131
 |
 |

51
(iv) covenants relating to recordkeeping, access to information and similar matters. The Notes are also subject to customary
rapid amortization events provided for in the Indenture, including events tied to failure of the Securitization Entities to maintain
the stated debt service coverage (“DSCR”) ratio, the sum of domestic retail sales for all restaurants being below certain levels
on certain measurement dates, certain manager termination events, certain events of default and the failure to repay or refinance
the Notes on the Class A-2 Anticipated Repayment Date. The Notes are also subject to certain customary events of default,
including events relating to non-payment of required interest, principal or other amounts due on or with respect to the Notes,
failure of the Securitization Entities to maintain the stated debt service coverage ratio, failure to comply with covenants within
certain time frames, certain bankruptcy events, breaches of specified representations and warranties and certain judgments.
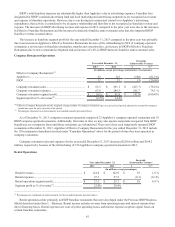
The DSCR ratio is Net Cash Flow for the four quarters preceding the calculation date divided by the total debt service
payments of the preceding four quarters. The complete definitions of the DSCR and all calculation elements are contained in
the Indenture filed as an Exhibit to Form 8-K filed on October 3, 2014. Failure to maintain a prescribed DSCR ratio can trigger
a Cash Trapping Event, A Rapid Amortization Event, a Manager Termination Event or a Default Event as described below. In a
Cash Trapping Event, the Trustee is required to retain a certain percentage of cash flow in a restricted account. In a Rapid
Amortization Event, all excess Cash Flow is retained and used to retire principal amounts of debt. Key DSCR ratios are as
follows:
• DSCR less than 1.75x but equal to or greater than 1.50x - Cash Trapping Event, 50% of Net Cash Flow
• DSCR less than 1.50x - Cash Trapping Event, 100% of Net Cash Flow
• DSCR less than 1.30x - Rapid Amortization Event
• DSCR less than 1.20x - Manager Termination Event
• DSCR less than 1.10x - Default Event
Our DSCR for the reporting period ended December 31, 2014 was 4.9x.
Based on our current level of operations, we believe that our cash flow from operations, available cash and available
borrowings under our Variable Funding Notes will be adequate to meet our liquidity needs during 2015.
Previous Credit Facilities
We had a $75.0 million revolving credit facility (the “Revolving Facility”) under our extinguished Credit Facility. We did
not borrow from our Revolving Facility during 2014 and there were no outstanding borrowings under the Revolving Facility
when the Credit Facility was extinguished on September 30, 2014. The Revolving Facility also was used to collateralize letters
of credit that were required for insurance purposes.
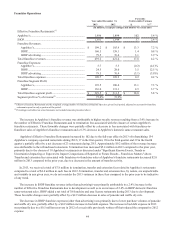
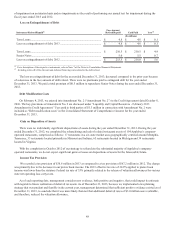
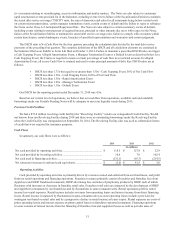
Cash Flows
In summary, our cash flows were as follows:
2014 2013 2012
(In millions)
Net cash provided by operating activities ....................................................... $ 118.5 $ 127.8 $ 52.9
Net cash provided by investing activities ....................................................... 10.6 7.0 165.4
Net cash used in financing activities............................................................... (131.1)(93.3)(214.5)
Net (decrease) increase in cash and cash equivalents ..................................... $ (2.0) $ 41.5 $ 3.8
Operating Activities
Cash provided by operating activities is primarily driven by revenues earned and collected from our franchisees, and profit
from our rental operations and financing operations. Franchise revenues primarily consist of royalties and franchise fees from
Applebee's and IHOP franchised restaurants, IHOP advertising fees and sales of proprietary products by IHOP, each of which
fluctuates with increases or decreases in franchise retail sales. Franchise retail sales are impacted by the development of IHOP
and Applebee's restaurants by our franchisees and by fluctuations in same-restaurant sales. Rental operations profit is rental
income less rental expenses. Rental income includes revenues from operating leases and interest income from direct financing
leases. Rental income is impacted by fluctuations in same-restaurant sales as some operating leases include a provision for
contingent rent based on retail sales and by a progressive decline in rental income as leases expire. Rental expenses are costs of
prime operating leases and interest expense on prime capital leases on franchisee-operated restaurants. Financing operations
revenue consists of interest income from the financing of franchise fees and equipment leases as well as periodic sales of