IHOP 2014 Annual Report Download - page 103
Download and view the complete annual report
Please find page 103 of the 2014 IHOP annual report below. You can navigate through the pages in the report by either clicking on the pages listed below, or by using the keyword search tool below to find specific information within the annual report.-
 1
1 -
2
-
3
-
4
-
5
-
6
-
7
-
8
-
9
-
10
-
11
-
12
-
13
-
14
-
15
-
16
-
17
-
18
-
19
-
20
-
21
-
22
-
23
-
24
-
25
-
26
-
27
-
28
-
29
-
30
-
31
-
32
-
33
-
34
-
35
-
36
-
37
-
38
-
39
-
40
-
41
-
42
-
43
-
44
-
45
-
46
-
47
-
48
-
49
-
50
-
51
-
52
-
53
-
54
-
55
-
56
-
57
-
58
-
59
-
60
-
61
-
62
-
63
-
64
-
65
-
66
-
67
-
68
-
69
-
70
-
71
-
72
-
73
-
74
-
75
-
76
-
77
-
78
-
79
-
80
-
81
-
82
-
83
-
84
-
85
-
86
-
87
-
88
-
89
-
90
-
91
-
92
-
 93
93 -
 94
94 -
 95
95 -
 96
96 -
 97
97 -
 98
98 -
 99
99 -
 100
100 -
 101
101 -
 102
102 -
 103
103 -
 104
104 -
 105
105 -
 106
106 -
 107
107 -
 108
108 -
 109
109 -
 110
110 -
 111
111 -
 112
112 -
 113
113 -
114
-
115
-
116
-
117
-
118
-
119
-
120
-
121
-
122
-
123
-
124
-
125
-
126
-
127
-
128
-
129
-
130
-
131
 |
 |

DineEquity, Inc. and Subsidiaries
Notes to the Consolidated Financial Statements (Continued)
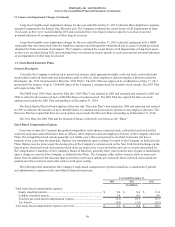
9. Leases (Continued)
84
Capital
Leases
Operating
Leases
(In millions)
2015 (1) ......................................................................................................................................... $ 26.2 $ 83.5
2016 ............................................................................................................................................ 24.0 75.9
2017 (1) ......................................................................................................................................... 21.4 68.4
2018 ............................................................................................................................................ 20.6 72.6
2019 ............................................................................................................................................ 17.2 68.4
Thereafter.................................................................................................................................... 58.7 328.5
Total minimum lease payments .................................................................................................. 168.1 $ 697.3
Less: interest ............................................................................................................................... (55.3)
Capital lease obligations ............................................................................................................. 112.8
Less: current portion (2)................................................................................................................ (14.7)
Long-term capital lease obligations............................................................................................ $ 98.1
______________________________________________________
(1) Due to the varying closing date of the Company's fiscal year, 13 monthly payments will be made in fiscal 2015 and 11 monthly payments in fiscal 2017.
(2) Included in current maturities of capital lease and financing obligations on the consolidated balance sheet.
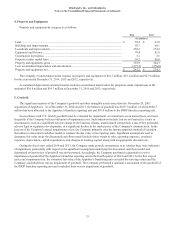
The asset cost and carrying amount on company-owned property leased at December 31, 2014 was $90.1 million and
$64.5 million, respectively. The asset cost and carrying amount on company-owned property leased at December 31, 2013, was
$90.1 million and $66.1 million, respectively. The asset cost and carrying amounts represent the land and building asset values
and net book values on sites leased to franchisees.
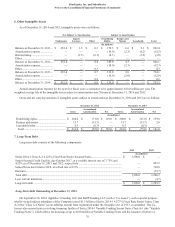
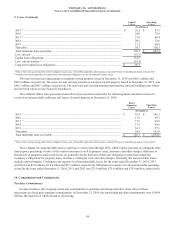
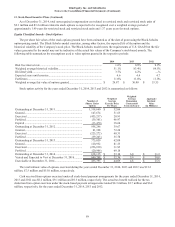
The minimum future lease payments shown above have not been reduced by the following future minimum rents to be
received on noncancelable subleases and leases of owned property at December 31, 2014:
Direct
Financing
Leases
Operating
Leases
(In millions)
2015 (1) ......................................................................................................................................... $ 18.3 $ 101.5
2016 ............................................................................................................................................ 17.8 99.7
2017 (1) ......................................................................................................................................... 17.9 99.6
2018 ............................................................................................................................................ 17.5 98.9
2019 ............................................................................................................................................ 16.3 97.1
Thereafter.................................................................................................................................... 38.9 555.8
Total minimum rents receivable ................................................................................................. $ 126.7 $ 1,052.6
________________________________________________________________________
(1) Due to the varying closing date of the Company's fiscal year, 13 monthly payments will be made in fiscal 2015 and 11 monthly payments in fiscal 2017.
The Company has noncancelable leases, expiring at various dates through 2032, which require payment of contingent rents
based upon a percentage of sales of the related restaurant as well as property taxes, insurance and other charges. Subleases to
franchisees of properties under such leases are generally for the full term of the lease obligation at rents that include the
Company's obligations for property taxes, insurance, contingent rents and other charges. Generally, the noncancelable leases
include renewal options. Contingent rent expense for all noncancelable leases for the years ended December 31, 2014, 2013
and 2012 was $2.8 million, $2.8 million and $2.7 million, respectively. Minimum rent expense for all noncancelable operating
leases for the years ended December 31, 2014, 2013 and 2012 was $75.9 million, $75.4 million and $78.0 million, respectively.
10. Commitments and Contingencies
Purchase Commitments
In some instances, the Company enters into commitments to purchase advertising and other items. Most of these
agreements are fixed price purchase commitments. At December 31, 2014, the outstanding purchase commitments were $108.4
million, the majority of which related to advertising.