Holiday Inn 2007 Annual Report Download - page 99
Download and view the complete annual report
Please find page 99 of the 2007 Holiday Inn annual report below. You can navigate through the pages in the report by either clicking on the pages listed below, or by using the keyword search tool below to find specific information within the annual report.-
 1
1 -
2
-
3
-
4
-
5
-
6
-
7
-
8
-
9
-
10
-
11
-
12
-
13
-
14
-
15
-
16
-
17
-
18
-
19
-
20
-
21
-
22
-
23
-
24
-
25
-
26
-
27
-
28
-
29
-
30
-
31
-
32
-
33
-
34
-
35
-
36
-
37
-
38
-
39
-
40
-
41
-
42
-
43
-
44
-
45
-
46
-
47
-
48
-
49
-
50
-
51
-
52
-
53
-
54
-
55
-
56
-
57
-
58
-
59
-
60
-
61
-
62
-
63
-
64
-
65
-
66
-
67
-
68
-
69
-
70
-
71
-
72
-
73
-
74
-
75
-
76
-
77
-
78
-
79
-
80
-
81
-
82
-
83
-
84
-
85
-
86
-
87
-
88
-
 89
89 -
 90
90 -
 91
91 -
 92
92 -
 93
93 -
 94
94 -
 95
95 -
 96
96 -
 97
97 -
 98
98 -
 99
99 -
 100
100 -
 101
101 -
 102
102 -
 103
103 -
 104
104
 |
 |

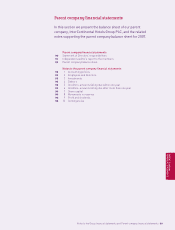
USEFUL INFORMATION
Glossary and Shareholder profiles 97
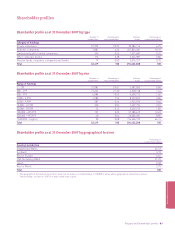
Shareholder profiles
USEFUL INFORMATION
Shareholder profile as at 31 December 2007 by type
Number of Percentage of Ordinary Percentage of
shareholders total shareholders shares issued share capital
Category of holdings
Private individuals 57,992 92.92 20,584,116 6.99
Nominee companies 3,887 6.24 267,864,281 90.92
Limited and public limited companies 345 0.56 1,551,687 0.53
Other corporate bodies 176 0.28 2,546,987 0.86
Pension funds, insurance companies and banks 19 0.00 2,076,237 0.70
Total 62,419 100 294,623,308 100
Shareholder profile as at 31 December 2007 by size
Number of Percentage of Ordinary Percentage of
shareholders total shareholders shares issued share capital
Range of holdings
1 – 199 37,081 59.41 2,481,005 0.84
200 – 499 13,234 21.20 4,248,148 1.44
500 – 999 6,584 10.55 4,609,712 1.56
1,000 – 4,999 4,580 7.34 8,392,813 2.86
5,000 – 9,999 287 0.46 1,953,592 0.66
10,000 – 49,999 330 0.53 7,457,794 2.53
50,000 – 99,999 76 0.12 5,402,215 1.83
100,000 – 499,999 157 0.25 37,385,619 12.69
500,000 – 999,999 40 0.06 26,086,281 8.85
1,000,000 – highest 50 0.08 196,606,129 66.74
Total 62,419 100 294,623,308 100
Shareholder profile as at 31 December 2007 by geographical location
Percentage of
issued share capital1
Country/Jurisdiction
England and Wales 65.12
Scotland 3.72
Rest of Europe 6.66
USA (including ADRs) 21.23
Japan 0.48
Rest of World 2.79
Total 100
1 The geographical distribution presented is based on an analysis of shareholdings of 150,000 or above where geographical ownership is known.
These holdings account for 76.97% of total issued share capital.