Holiday Inn 2007 Annual Report Download - page 14
Download and view the complete annual report
Please find page 14 of the 2007 Holiday Inn annual report below. You can navigate through the pages in the report by either clicking on the pages listed below, or by using the keyword search tool below to find specific information within the annual report.-
 1
1 -
2
-
3
-
 4
4 -
 5
5 -
 6
6 -
 7
7 -
 8
8 -
 9
9 -
 10
10 -
 11
11 -
 12
12 -
 13
13 -
 14
14 -
 15
15 -
 16
16 -
 17
17 -
 18
18 -
 19
19 -
 20
20 -
 21
21 -
 22
22 -
 23
23 -
 24
24 -
25
-
26
-
27
-
28
-
29
-
30
-
31
-
32
-
33
-
34
-
35
-
36
-
37
-
38
-
39
-
40
-
41
-
42
-
43
-
44
-
45
-
46
-
47
-
48
-
49
-
50
-
51
-
52
-
53
-
54
-
55
-
56
-
57
-
58
-
59
-
60
-
61
-
62
-
63
-
64
-
65
-
66
-
67
-
68
-
69
-
70
-
71
-
72
-
73
-
74
-
75
-
76
-
77
-
78
-
79
-
80
-
81
-
82
-
83
-
84
-
85
-
86
-
87
-
88
-
89
-
90
-
91
-
92
-
93
-
94
-
95
-
96
-
97
-
98
-
99
-
100
-
101
-
102
-
103
-
104
 |
 |

12 IHG Annual Report and Financial Statements 2007
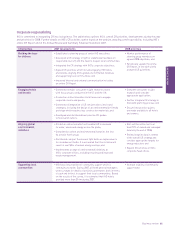
Business review continued
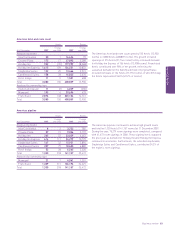
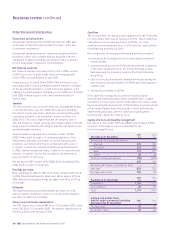
12 months ended 31 December
2007 2006 %
£m £m change
Revenue
Americas 450 422 6.6
EMEA 245 198 23.7
Asia Pacific 130 111 17.1
Central 58 55 5.5
Continuing operations 883 786 12.3
Discontinued operations 40 174 (77.0)
923 960 (3.9)
Operating profit
Americas 220 215 2.3
EMEA 67 37 81.1
Asia Pacific 31 29 6.9
Central (81) (81) –
Continuing operations 237 200 18.5
Discontinued operations 831 (74.2)
Operating profit before
exceptional items 245 231 6.1
Exceptional operating items 30 27 11.1
Operating profit 275 258 6.6
Net financial expenses (45) (11) (309.1)
Profit before tax* 230 247 (6.9)
Analysed as:
Continuing operations 222 216 2.8
Discontinued operations 831 (74.2)
Earnings per ordinary share
Basic 72.2p 104.1p (30.6)
Adjusted 48.4p 42.9p 12.8
Adjusted – continuing operations 46.9p 38.0p 23.4
* Profit before tax includes the results of discontinued operations.
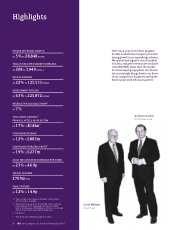
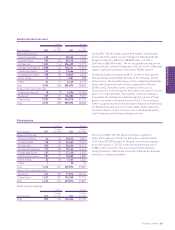
Revenue from continuing operations increased by 12.3% to
£883m and continuing operating profit increased by 18.5% to
£237m during the 12 months ended 31 December 2007. The
growth was driven by strong underlying RevPAR gains across
all regions, hotel expansion in key markets and profit uplift
from owned and leased assets. Furthermore, strong revenue
conversion led to a 1.4 percentage point increase in continuing
operating profit margins to 26.8%.
Including discontinued operations, total revenue decreased by
3.9% to £923m whilst operating profit before exceptional items
increased by 6.1% to £245m, reflecting the year-on-year impact
of asset disposals. Discontinued operations represent the results
from operations that have been sold, or are held for sale, and
where there is a coordinated plan to dispose of the operations
under IHG’s asset disposal programme. In this Business Review,
discontinued operations include owned and leased hotels in the
US, the UK and Continental Europe that have been sold or placed
on the market from 1 January 2006.
As the weighted average US dollar exchange rate to sterling has
weakened during 2007 (2007 $2.01:£1, 2006 $1.84:£1), growth
rates for results expressed in US dollars are higher than those
in sterling. Continuing operating profit before exceptional items
was $474m, ahead of 2006 by 29.2%. Including discontinued
operations, operating profit before exceptional items was
$491m, 15.8% higher than 2006. Translated at constant currency,
applying 2006 exchange rates, continuing revenue increased
by 19.6% and continuing operating profit increased by 30.0%.
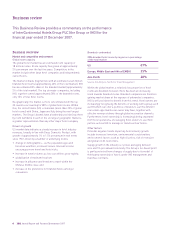
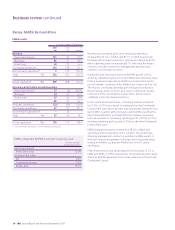
One measure of overall IHG hotel system performance is the
growth in total gross revenue, defined as total room revenue from
franchised hotels and total hotel revenue from managed, owned
and leased hotels. Total gross revenue is not revenue attributable
to IHG, as it is derived mainly from hotels owned by third parties.
Total gross revenue increased by 17.1% from $15.2bn in 2006
to $17.8bn in 2007, with strong growth levels achieved across
IHG’s key brands reflecting hotel performance and room growth.
Translated at constant currency, total gross revenue increased
by 14.5%.
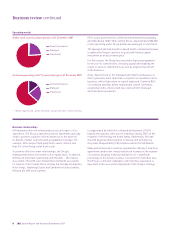
Group performance
Group results
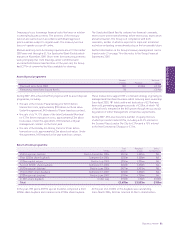
Total gross revenues
12 months ended 31 December
2007 2006 %
$bn $bn change
InterContinental 3.7 3.0 23.3
Crowne Plaza 2.8 2.3 21.7
Holiday Inn 6.7 6.3 6.3
Holiday Inn Express 3.5 3.0 16.7
Other brands 1.1 0.6 83.3
Total 17.8 15.2 17.1