Holiday Inn 2007 Annual Report Download - page 73
Download and view the complete annual report
Please find page 73 of the 2007 Holiday Inn annual report below. You can navigate through the pages in the report by either clicking on the pages listed below, or by using the keyword search tool below to find specific information within the annual report.-
 1
1 -
2
-
3
-
4
-
5
-
6
-
7
-
8
-
9
-
10
-
11
-
12
-
13
-
14
-
15
-
16
-
17
-
18
-
19
-
20
-
21
-
22
-
23
-
24
-
25
-
26
-
27
-
28
-
29
-
30
-
31
-
32
-
33
-
34
-
35
-
36
-
37
-
38
-
39
-
40
-
41
-
42
-
43
-
44
-
45
-
46
-
47
-
48
-
49
-
50
-
51
-
52
-
53
-
54
-
55
-
56
-
57
-
58
-
59
-
60
-
61
-
62
-
 63
63 -
 64
64 -
 65
65 -
 66
66 -
 67
67 -
 68
68 -
 69
69 -
 70
70 -
 71
71 -
 72
72 -
 73
73 -
 74
74 -
 75
75 -
 76
76 -
 77
77 -
 78
78 -
 79
79 -
 80
80 -
 81
81 -
 82
82 -
 83
83 -
84
-
85
-
86
-
87
-
88
-
89
-
90
-
91
-
92
-
93
-
94
-
95
-
96
-
97
-
98
-
99
-
100
-
101
-
102
-
103
-
104
 |
 |

GROUP FINANCIAL
STATEMENTS
Notes to the Group financial statements 71
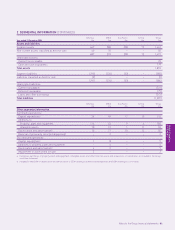
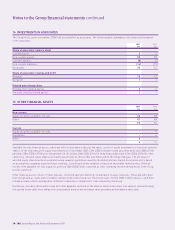
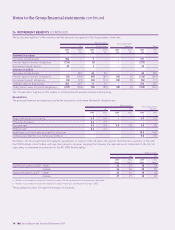
15 OTHER FINANCIAL ASSETS (CONTINUED)
The movement in the provision for impairment of other financial assets during the year is as follows:
2007 2006
£m £m
At 1 January (21) (16)
Provided and charged to gain on disposal of assets –(10)
Recoveries 23
Disposals 3–
Amounts written off against the financial asset 12 1
Exchange and other adjustments –1
At 31 December (4) (21)
The provision is used to record impairment losses unless the Group is satisfied that no recovery of the amount is possible; at that point
the amount considered irrecoverable is written off against the financial asset directly with no impact on the income statement.
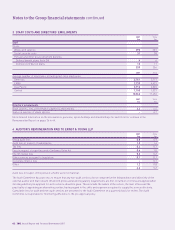
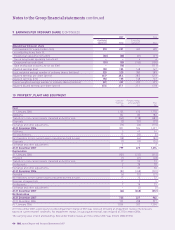
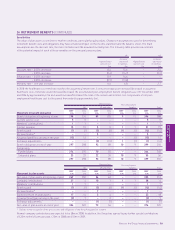
16 INVENTORIES
2007 2006
£m £m
Finished goods 11
Consumable stores 22
33
17 TRADE AND OTHER RECEIVABLES
2007 2006
£m £m
Trade receivables 180 163
Other receivables 29 51
Prepayments 26 23
235 237
Trade and other receivables are designated as ‘loans and receivables’ and are held at amortised cost.
Trade receivables are non-interest bearing and are generally on payment terms of up to 30 days. The fair value of trade and other
receivables approximates their carrying value.
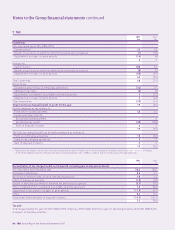
The maximum exposure to credit risk for trade and other receivables, excluding prepayments, at the balance sheet date by geographic region is:
2007 2006
£m £m
Americas 115 105
Europe, Middle East and Africa 70 78
Asia Pacific 24 31
209 214
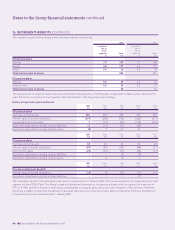
The aging of trade and other receivables, excluding prepayments, at the balance sheet date is:
2007 2006
Gross Provision Net Gross Provision Net
£m £m £m £m £m £m
Not past due 141 (1) 140 118 – 118
Past due 1 to 30 days 37 (1) 36 62 (1) 61
Past due 31 to 180 days 39 (8) 31 49 (16) 33
More than 180 days 40 (38) 2 28 (26) 2
257 (48) 209 257 (43) 214
GROUP FINANCIAL
STATEMENTS