Holiday Inn 2007 Annual Report Download - page 68
Download and view the complete annual report
Please find page 68 of the 2007 Holiday Inn annual report below. You can navigate through the pages in the report by either clicking on the pages listed below, or by using the keyword search tool below to find specific information within the annual report.-
 1
1 -
2
-
3
-
4
-
5
-
6
-
7
-
8
-
9
-
10
-
11
-
12
-
13
-
14
-
15
-
16
-
17
-
18
-
19
-
20
-
21
-
22
-
23
-
24
-
25
-
26
-
27
-
28
-
29
-
30
-
31
-
32
-
33
-
34
-
35
-
36
-
37
-
38
-
39
-
40
-
41
-
42
-
43
-
44
-
45
-
46
-
47
-
48
-
49
-
50
-
51
-
52
-
53
-
54
-
55
-
56
-
57
-
 58
58 -
 59
59 -
 60
60 -
 61
61 -
 62
62 -
 63
63 -
 64
64 -
 65
65 -
 66
66 -
 67
67 -
 68
68 -
 69
69 -
 70
70 -
 71
71 -
 72
72 -
 73
73 -
 74
74 -
 75
75 -
 76
76 -
 77
77 -
 78
78 -
79
-
80
-
81
-
82
-
83
-
84
-
85
-
86
-
87
-
88
-
89
-
90
-
91
-
92
-
93
-
94
-
95
-
96
-
97
-
98
-
99
-
100
-
101
-
102
-
103
-
104
 |
 |

66 IHG Annual Report and Financial Statements 2007
Notes to the Group financial statements continued
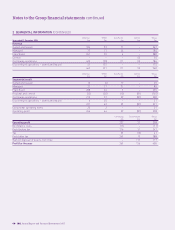
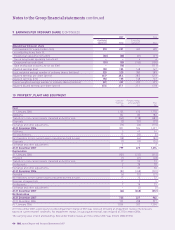
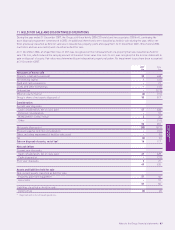
9 EARNINGS PER ORDINARY SHARE (CONTINUED)
2007 2006
Continuing Continuing
operations Total operations Total
Adjusted earnings per share
Profit available for equity holders (£m) 210 231 269 405
Less adjusting items (note 5):
Exceptional operating items (£m) (30) (30) (27) (27)
Tax on exceptional operating items (£m) ––66
Exceptional tax credit (£m) (30) (30) (100) (100)
Gain on disposal of assets, net of tax (£m) – (16) – (117)
Adjusted earnings (£m) 150 155 148 167
Basic weighted average number of ordinary shares (millions) 320 320 389 389
Adjusted earnings per share (pence) 46.9 48.4 38.0 42.9
Adjusted earnings (£m) 150 155 148 167
Diluted weighted average number of ordinary shares (millions) 329 329 399 399
Adjusted diluted earnings per share (pence) 45.6 47.1 37.1 41.8
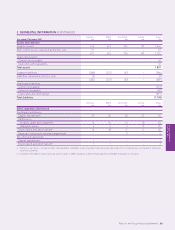
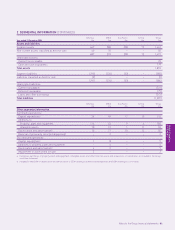
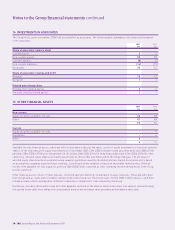
10 PROPERTY, PLANT AND EQUIPMENT
Land and Fixtures, fittings
buildings and equipment Total
£m £m £m
Cost
At 1 January 2006 1,155 615 1,770
Additions 104 82 186
Transfers to non-current assets classified as held for sale (363) (118) (481)
Disposals (2) (31) (33)
Exchange and other adjustments (73) (42) (115)
At 31 December 2006 821 506 1,327
Additions 54954
Reclassifications 15 (20) (5)
Net transfers to non-current assets classified as held for sale (38) (44) (82)
Disposals (7) (19) (26)
Exchange and other adjustments 3 3 6
At 31 December 2007 799 475 1,274
Depreciation
At 1 January 2006 (101) (313) (414)
Provided (7) (41) (48)
Transfers to non-current assets classified as held for sale 17 55 72
On disposals 22830
Exchange and other adjustments 7 23 30
At 31 December 2006 (82) (248) (330)
Provided (6) (33) (39)
Net transfers to non-current assets classified as held for sale 17 15 32
Reversal of impairment –33
On disposals 71825
Exchange and other adjustments – (3) (3)
At 31 December 2007 (64) (248) (312)
Net book value
At 31 December 2007 735 227 962
At 31 December 2006 739 258 997
At 1 January 2006 1,054 302 1,356
At 31 December 2007, a previously recorded impairment charge of £3m was reversed following an impairment review of hotel assets
based on current market conditions. No impairment charge, or subsequent reversal, was required at 31 December 2006.
The carrying value of land and buildings held under finance leases at 31 December 2007 was £104m (2006 £93m).