Holiday Inn 2007 Annual Report Download - page 78
Download and view the complete annual report
Please find page 78 of the 2007 Holiday Inn annual report below. You can navigate through the pages in the report by either clicking on the pages listed below, or by using the keyword search tool below to find specific information within the annual report.-
 1
1 -
2
-
3
-
4
-
5
-
6
-
7
-
8
-
9
-
10
-
11
-
12
-
13
-
14
-
15
-
16
-
17
-
18
-
19
-
20
-
21
-
22
-
23
-
24
-
25
-
26
-
27
-
28
-
29
-
30
-
31
-
32
-
33
-
34
-
35
-
36
-
37
-
38
-
39
-
40
-
41
-
42
-
43
-
44
-
45
-
46
-
47
-
48
-
49
-
50
-
51
-
52
-
53
-
54
-
55
-
56
-
57
-
58
-
59
-
60
-
61
-
62
-
63
-
64
-
65
-
66
-
67
-
 68
68 -
 69
69 -
 70
70 -
 71
71 -
 72
72 -
 73
73 -
 74
74 -
 75
75 -
 76
76 -
 77
77 -
 78
78 -
 79
79 -
 80
80 -
 81
81 -
 82
82 -
 83
83 -
 84
84 -
 85
85 -
 86
86 -
 87
87 -
 88
88 -
89
-
90
-
91
-
92
-
93
-
94
-
95
-
96
-
97
-
98
-
99
-
100
-
101
-
102
-
103
-
104
 |
 |

76 IHG Annual Report and Financial Statements 2007
Notes to the Group financial statements continued
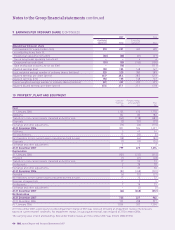
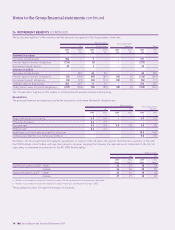
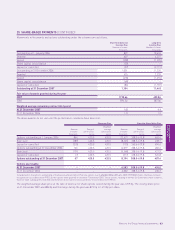
22 FINANCIAL INSTRUMENTS (CONTINUED)
Interest rate risk (continued)
Repricing analysis
Effective Total Between
interest carrying Less than 6 months Between 1 and More than
rate amount 6 months and 1 year 2 years 5 years
%£m£m£m£m£m
31 December 2006
Cash and cash equivalents 0.0 – 5.2 (179) (179) – – –
Secured bank loans 8.5 7 7 – – –
Finance lease obligations* 9.7 97 – – – 97
Unsecured bank loans:
Euro floating rate 4.0 54 54 – – –
– effect of euro interest rate swaps* (1.0) – (54) – 54 –
US dollar floating rate 5.7 53 53 – – –
– effect of US dollar interest rate swaps* (1.2) – (51) – 51 –
Sterling floating rate 5.6 102 102 – – –
Net debt 134 (68) – 105 97
Foreign exchange contracts (4) (4) – – –
130 (72) – 105 97
* These items bear interest at a fixed rate.
Interest rate swaps are included in the above tables to the extent that they affect the Group’s interest rate repricing risk. The swaps
hedge the floating rate debt by fixing the interest rate. The effect shown above is their impact on the debt’s floating rate, for an amount
equal to their notional principal (principal and maturity of swap is shown in repricing analysis). The fair values of derivatives are recorded
in other financial assets and other payables.
Trade and other receivables and trade and other payables are not included above as they are not interest bearing.
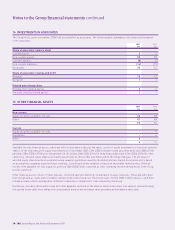
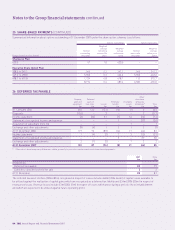
Fair values
The table below compares carrying amounts and fair values of the Group’s financial assets and liabilities.
2007 2006
Carrying Carrying
value Fair value value Fair value
Note £m £m £m £m
Financial assets
Equity securities available-for-sale 15 46 46 57 57
Loans and receivables:
Cash and cash equivalents 18 52 52 179 179
Other financial assets 15 56 56 48 48
Trade and other receivables, excluding prepayments 17 209 209 214 214
Derivatives 15 ––44
Financial liabilities
Borrowings, excluding finance lease obligations 20 (777) (777) (216) (216)
Finance lease obligations 20 (100) (126) (97) (97)
Trade and other payables 19 (527) (527) (511) (511)
Derivatives 19 (2) (2) ––
The fair value of cash and cash equivalents approximates book value due to the short maturity of the investments and deposits. Equity
securities available-for-sale and derivatives are held on the balance sheet at fair value as set out in note 15. The fair value of other
financial assets approximates book value based on prevailing market rates. The fair value of borrowings, excluding finance lease
obligations, approximates book value as interest rates reset to market rates on a frequent basis. The fair value of the finance lease
obligation is calculated by discounting future cash flows at prevailing interest rates. The fair value of trade and other receivables and
trade and other payables approximates to their carrying value, including the future redemption liability of the Group’s loyalty programme.