Holiday Inn 2007 Annual Report Download - page 16
Download and view the complete annual report
Please find page 16 of the 2007 Holiday Inn annual report below. You can navigate through the pages in the report by either clicking on the pages listed below, or by using the keyword search tool below to find specific information within the annual report.-
 1
1 -
2
-
3
-
4
-
5
-
 6
6 -
 7
7 -
 8
8 -
 9
9 -
 10
10 -
 11
11 -
 12
12 -
 13
13 -
 14
14 -
 15
15 -
 16
16 -
 17
17 -
 18
18 -
 19
19 -
 20
20 -
 21
21 -
 22
22 -
 23
23 -
 24
24 -
 25
25 -
 26
26 -
27
-
28
-
29
-
30
-
31
-
32
-
33
-
34
-
35
-
36
-
37
-
38
-
39
-
40
-
41
-
42
-
43
-
44
-
45
-
46
-
47
-
48
-
49
-
50
-
51
-
52
-
53
-
54
-
55
-
56
-
57
-
58
-
59
-
60
-
61
-
62
-
63
-
64
-
65
-
66
-
67
-
68
-
69
-
70
-
71
-
72
-
73
-
74
-
75
-
76
-
77
-
78
-
79
-
80
-
81
-
82
-
83
-
84
-
85
-
86
-
87
-
88
-
89
-
90
-
91
-
92
-
93
-
94
-
95
-
96
-
97
-
98
-
99
-
100
-
101
-
102
-
103
-
104
 |
 |

14 IHG Annual Report and Financial Statements 2007
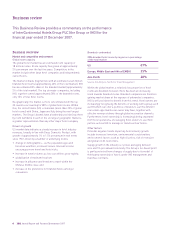
Business review continued
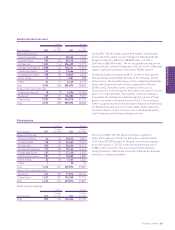
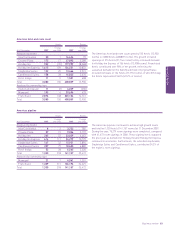
12 months ended 31 December
2007 2006 %
$m $m change
Revenue
Owned and leased 257 192 33.9
Managed 156 143 9.1
Franchised 489 443 10.4
Continuing operations 902 778 15.9
Discontinued operations* 62 74 (16.2)
Total $m 964 852 13.1
Sterling equivalent £m 481 463 3.9
Operating profit before exceptional items
Owned and leased 40 22 81.8
Managed 41 50 (18.0)
Franchised 425 382 11.3
506 454 11.5
Regional overheads (66) (59) (11.9)
Continuing operations 440 395 11.4
Discontinued operations* 16 12 33.3
Total $m 456 407 12.0
Sterling equivalent £m 228 221 3.2
* Discontinued operations are all owned and leased.
Revenue and operating profit from continuing operations
increased by 15.9% to $902m and 11.4% to $440m respectively.
Discontinued operations include the results of hotels sold during
2006 and 2007, together with two hotels currently on the market
for disposal. Including discontinued operations, revenue increased
by 13.1% whilst operating profit increased by 12.0%.
The region achieved healthy RevPAR growth across all ownership
types and RevPAR premiums to the US market segments for hotels
operating under InterContinental, Crowne Plaza, Holiday Inn and
Holiday Inn Express brands. During the fourth quarter, consistent
with the US market, the region was impacted by a marginal softening
in RevPAR growth due to a slight decline in occupancy levels.
Continuing owned and leased revenue increased by 33.9% to
$257m and operating profit increased by 81.8% to $40m. Positive
underlying trading was driven by RevPAR growth of 9.7%, led by
the InterContinental brand with growth of 10.6%. The results were
favourably impacted by trading performance at the InterContinental
Boston which became fully operational during the first half of the
year (year-on-year profit increase of $11m) and trading at the
InterContinental New York where robust market conditions lifted
average occupancy levels to over 90%.
Managed revenues increased by 9.1% to $156m during the year,
driven by strong RevPAR growth, particularly in Latin America where
rate-led RevPAR growth exceeded 20%. Robust brand performance
resulted in RevPAR growth premiums, compared to respective
US market segments, for InterContinental, Crowne Plaza and
Holiday Inn. Growth in the extended stay segment was impacted
by an increase in market supply. Managed revenues included
$86m (2006 $80m) from properties that are structured, for legal
reasons, as operating leases but with the same characteristics
as management contracts.
Managed operating profit decreased by 18.0% to $41m, including
$6m (2006 $9m) from managed properties held as operating leases.
The decline in profit principally reflects increased revenue
investment to support growth in contract signings, the impact
of fewer hotels under management contracts following the
restructuring of the FelCor agreement in 2006, foreign exchange
losses in Latin America and lower ancillary revenues together with
higher costs at one of the hotels held as an operating lease. These
items reduced operating profit margins in the managed estate by
8.7 percentage points to 26.3% and reduced continuing operating
profit margins in the region by 2.0 percentage points to 48.8%.
Franchised revenue and operating profit increased by 10.4%
to $489m and 11.3% to $425m respectively, compared to 2006.
The increase was driven by RevPAR growth of 5.8%, net room
count growth of 4.0% and fees associated with growth in signings.
Regional overheads were affected positively in 2006 by lower claims
in the Group-funded employee healthcare programme. Excluding
this, regional overheads were in line with the prior period.
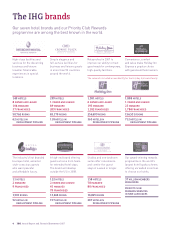
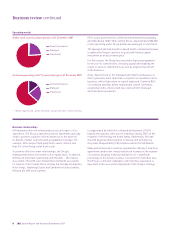
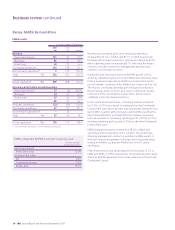
The Americas
Americas results
Americas comparable RevPAR movement on previous year
12 months ended
31 December 2007
Owned and leased
InterContinental 10.6%
Managed
InterContinental 10.8%
Crowne Plaza 7.2%
Holiday Inn 7.7%
Staybridge Suites 2.0%
Candlewood Suites 3.4%
Franchised
Crowne Plaza 7.6%
Holiday Inn 4.7%
Holiday Inn Express 6.7%