Holiday Inn 2007 Annual Report Download - page 8
Download and view the complete annual report
Please find page 8 of the 2007 Holiday Inn annual report below. You can navigate through the pages in the report by either clicking on the pages listed below, or by using the keyword search tool below to find specific information within the annual report.-
 1
1 -
 2
2 -
 3
3 -
 4
4 -
 5
5 -
 6
6 -
 7
7 -
 8
8 -
 9
9 -
 10
10 -
 11
11 -
 12
12 -
 13
13 -
 14
14 -
 15
15 -
 16
16 -
 17
17 -
 18
18 -
 19
19 -
20
-
21
-
22
-
23
-
24
-
25
-
26
-
27
-
28
-
29
-
30
-
31
-
32
-
33
-
34
-
35
-
36
-
37
-
38
-
39
-
40
-
41
-
42
-
43
-
44
-
45
-
46
-
47
-
48
-
49
-
50
-
51
-
52
-
53
-
54
-
55
-
56
-
57
-
58
-
59
-
60
-
61
-
62
-
63
-
64
-
65
-
66
-
67
-
68
-
69
-
70
-
71
-
72
-
73
-
74
-
75
-
76
-
77
-
78
-
79
-
80
-
81
-
82
-
83
-
84
-
85
-
86
-
87
-
88
-
89
-
90
-
91
-
92
-
93
-
94
-
95
-
96
-
97
-
98
-
99
-
100
-
101
-
102
-
103
-
104
 |
 |

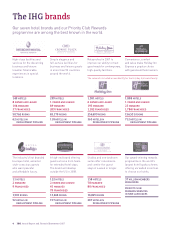
Business review
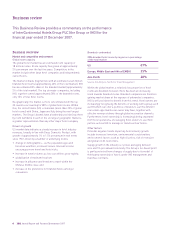
Business overview
Market and competitive environment
Global room capacity
The global hotel market has an estimated room capacity of
18 million rooms. Room capacity has grown at approximately
3% per annum over the last five years. Competitors in the
market include other large hotel companies and independently
owned hotels.
The market remains fragmented, with an estimated seven million
branded hotel rooms (approximately 40% of the total market). IHG
has an estimated 8% share of the branded market (approximately
3% of the total market). The top six major companies, including
IHG, together control approximately 38% of the branded rooms,
only 15% of total hotel rooms.
Geographically, the market is more concentrated with the top
20 countries accounting for 80% of global hotel rooms. Within
this, the United States (US) is dominant (more than 25% of global
hotel rooms) with China, Japan and Italy being the next largest
markets. The Group’s brands have a leadership position (top three
by room numbers) in each of the six largest geographic markets,
a greater representation than any other major hotel company.
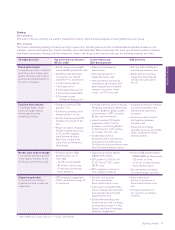
Drivers of growth
US market data indicates a steady increase in hotel industry
revenues, broadly in line with Gross Domestic Product, with
growth of approximately 1% to 1.5% per annum in real terms
since 1967, driven by a number of underlying trends:
• change in demographics – as the population ages and
becomes wealthier, increased leisure time and income
encourages more travel and hotel visits;
• increase in travel volumes as low cost airlines grow rapidly;
• globalisation of trade and tourism;
• increase in affluence and freedom to travel within the
Chinese middle class; and
• increase in the preference for branded hotels amongst
consumers.
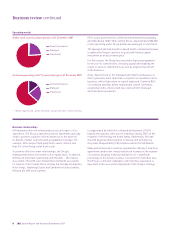
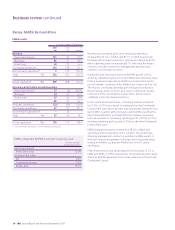
Branded v unbranded
2006 branded hotel rooms by region as a percentage
of the total market
US 67%
Europe, Middle East and Africa (EMEA) 35%
Asia Pacific 28%
Source: IHG Analysis, Northstar Travel Management.
Within the global market, a relatively low proportion of hotel
rooms are branded; however, there has been an increasing
trend towards branded rooms. Branded companies are therefore
gaining market share at the expense of unbranded companies.
IHG is well positioned to benefit from this trend. Hotel owners are
increasingly recognising the benefits of working with a group such
as IHG which can offer a portfolio of brands to suit the different
real estate opportunities an owner may have, together with
effective revenue delivery through global reservation channels.
Furthermore, hotel ownership is increasingly being separated
from hotel operations, encouraging hotel owners to use third
parties such as IHG to manage or franchise their hotels.
Other factors
Potential negative trends impacting hotel industry growth
include increased terrorism, environmental considerations
and economic factors such as high oil prices, risk of recession
and global credit restrictions.
Supply growth in the industry is cyclical, averaging between
zero and 5% per annum historically. The Group’s fee-based profit
is partly protected from changes of supply due to its model of
third-party ownership of hotels under IHG management and
franchise contracts.
6IHG Annual Report and Financial Statements 2007
This Business Review provides a commentary on the performance
of InterContinental Hotels Group PLC (the Group or IHG) for the
financial year ended 31 December 2007.