Holiday Inn 2007 Annual Report Download - page 21
Download and view the complete annual report
Please find page 21 of the 2007 Holiday Inn annual report below. You can navigate through the pages in the report by either clicking on the pages listed below, or by using the keyword search tool below to find specific information within the annual report.-
 1
1 -
2
-
3
-
4
-
5
-
6
-
7
-
8
-
9
-
10
-
 11
11 -
 12
12 -
 13
13 -
 14
14 -
 15
15 -
 16
16 -
 17
17 -
 18
18 -
 19
19 -
 20
20 -
 21
21 -
 22
22 -
 23
23 -
 24
24 -
 25
25 -
 26
26 -
 27
27 -
 28
28 -
 29
29 -
 30
30 -
 31
31 -
32
-
33
-
34
-
35
-
36
-
37
-
38
-
39
-
40
-
41
-
42
-
43
-
44
-
45
-
46
-
47
-
48
-
49
-
50
-
51
-
52
-
53
-
54
-
55
-
56
-
57
-
58
-
59
-
60
-
61
-
62
-
63
-
64
-
65
-
66
-
67
-
68
-
69
-
70
-
71
-
72
-
73
-
74
-
75
-
76
-
77
-
78
-
79
-
80
-
81
-
82
-
83
-
84
-
85
-
86
-
87
-
88
-
89
-
90
-
91
-
92
-
93
-
94
-
95
-
96
-
97
-
98
-
99
-
100
-
101
-
102
-
103
-
104
 |
 |

BUSINESS REVIEW
Business review 19
BUSINESS REVIEW
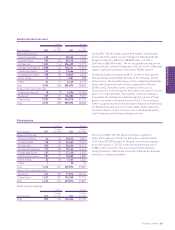
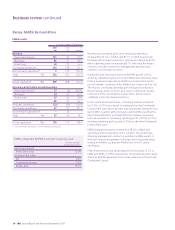
Hotels Rooms
Change Change
At 31 December 2007 over 2006 2007 over 2006
Analysed by brand
InterContinental 37 414,126 2,475
Crowne Plaza 55 317,951 1,363
Holiday Inn 94 325,858 2,083
Holiday Inn Express 11 32,600 845
Other 21 17 6,140 5,172
Total 218 30 66,675 11,938
Analysed by ownership type
Owned and leased 2–693 –
Managed 175 26 56,114 10,832
Franchised 41 49,868 1,106
Total 218 30 66,675 11,938
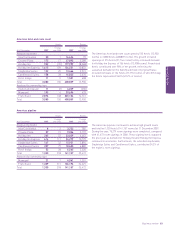
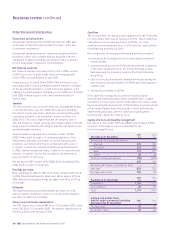
Hotels Rooms
Change Change
At 31 December 2007 over 2006 2007 over 2006
Analysed by brand
InterContinental 30 10 10,331 2,604
Crowne Plaza 56 35 21,028 13,421
Holiday Inn 49 16 14,370 3,980
Holiday Inn Express 22 10 6,097 1,572
Total 157 71 51,826 21,577
Analysed by ownership type
Managed 156 70 51,650 21,401
Franchised 11176 176
Total 157 71 51,826 21,577
12 months ended 31 December
2007 2006 %
£m £m change
Revenue 58 55 5.5
Gross central costs (139) (136) (2.2)
Net central costs £m (81) (81) –
Dollar equivalent $m (163) (149) (9.4)
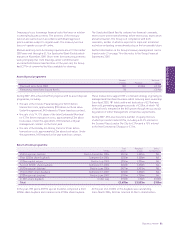
Asia Pacific hotel and room count increased by 30 hotels
(11,938 rooms) to 218 hotels (66,675 rooms). The net growth
included 16 hotels (7,827 rooms) in Greater China reflecting
continued expansion in one of IHG’s strategic markets, together
with 15 hotels (3,542 rooms) in Japan that joined the system as
part of the IHG ANA joint venture.
The pipeline in Asia Pacific increased by 71 hotels (21,577 rooms)
to 157 hotels (51,826 rooms). Demand in the Greater China
market continued throughout the year and represented 82.3%
of the region’s room signings. From a brand perspective, Crowne
Plaza attracted significant interest, contributing over half of the
total room signings.
During 2007, net central costs were flat on 2006 but increased
in line with inflation when translated at constant currency
exchange rates.
Asia Pacific hotel and room count
Asia Pacific pipeline
Central
Central results