Holiday Inn 2007 Annual Report Download - page 80
Download and view the complete annual report
Please find page 80 of the 2007 Holiday Inn annual report below. You can navigate through the pages in the report by either clicking on the pages listed below, or by using the keyword search tool below to find specific information within the annual report.-
 1
1 -
2
-
3
-
4
-
5
-
6
-
7
-
8
-
9
-
10
-
11
-
12
-
13
-
14
-
15
-
16
-
17
-
18
-
19
-
20
-
21
-
22
-
23
-
24
-
25
-
26
-
27
-
28
-
29
-
30
-
31
-
32
-
33
-
34
-
35
-
36
-
37
-
38
-
39
-
40
-
41
-
42
-
43
-
44
-
45
-
46
-
47
-
48
-
49
-
50
-
51
-
52
-
53
-
54
-
55
-
56
-
57
-
58
-
59
-
60
-
61
-
62
-
63
-
64
-
65
-
66
-
67
-
68
-
69
-
 70
70 -
 71
71 -
 72
72 -
 73
73 -
 74
74 -
 75
75 -
 76
76 -
 77
77 -
 78
78 -
 79
79 -
 80
80 -
 81
81 -
 82
82 -
 83
83 -
 84
84 -
 85
85 -
 86
86 -
 87
87 -
 88
88 -
 89
89 -
 90
90 -
91
-
92
-
93
-
94
-
95
-
96
-
97
-
98
-
99
-
100
-
101
-
102
-
103
-
104
 |
 |

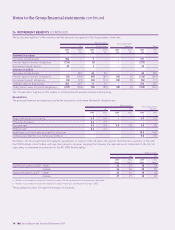
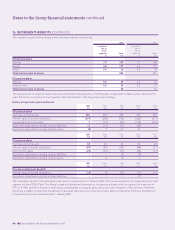
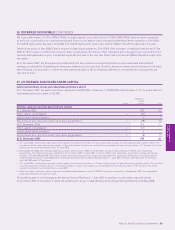
24 RETIREMENT BENEFITS (CONTINUED)
The assets and liabilities of the schemes and the amounts recognised in the Group balance sheet are:
Pension plans Post-employment
UK US and other benefits Total
2007 2006 2007 2006 2007 2006 2007 2006
£m £m £m £m £m £m £m £m
Schemes in surplus
Fair value of plan assets 304 –7–––311 –
Present value of benefit obligations (274) –(5) –––(279) –
Retirement benefit assets 30 –2–––32 –
Schemes in deficit
Fair value of plan assets –269 65 56 ––65 325
Present value of benefit obligations (23) (298) (87) (89) (10) (9) (120) (396)
Retirement benefit obligations (23) (29) (22) (33) (10) (9) (55) (71)
Total fair value of plan assets 304 269 72 56 ––376 325
Total present value of benefit obligations (297) (298) (92) (89) (10) (9) (399) (396)
The ‘US and other’ surplus of £2m relates to a defined benefit pension scheme in Hong Kong.
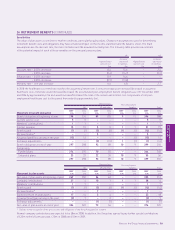
Assumptions
The principal financial assumptions used by the actuaries to determine the benefit obligation are:
Pension plans Post-employment
UK US benefits
2007 2006 2007 2006 2007 2006
%%%%%%
Wages and salaries increases 4.9 4.6 ––4.0 4.0
Pensions increases 3.4 3.1 ––––
Discount rate 5.5 5.0 5.8 5.8 5.8 5.8
Inflation rate 3.4 3.1 ––––
Healthcare cost trend rate assumed for next year 10.0 10.0
Ultimate rate that the cost trend rate trends to 5.0 5.0
Mortality is the most significant demographic assumption. In respect of the UK plans, the specific mortality rates used are in line with
the PA92 medium cohort tables, with age rated down by one year, implying the following life expectancies at retirement. In the US, life
expectancy is determined by reference to the RP-2000 healthy tables.
Pension plans
UK US
2007 2006 2007 2006
Years Years Years Years
Current pensioners at 65a– male 23 23 18 18
– female 26 26 20 20
Future pensioners at 65b– male 24 24 18 18
– female 27 27 20 20
a Relates to assumptions based on longevity (in years) following retirement at the balance sheet date.
b Relates to assumptions based on longevity (in years) relating to an employee retiring in 2027.
The assumptions allow for expected increases in longevity.
78 IHG Annual Report and Financial Statements 2007
Notes to the Group financial statements continued