Holiday Inn 2007 Annual Report Download - page 71
Download and view the complete annual report
Please find page 71 of the 2007 Holiday Inn annual report below. You can navigate through the pages in the report by either clicking on the pages listed below, or by using the keyword search tool below to find specific information within the annual report.-
 1
1 -
2
-
3
-
4
-
5
-
6
-
7
-
8
-
9
-
10
-
11
-
12
-
13
-
14
-
15
-
16
-
17
-
18
-
19
-
20
-
21
-
22
-
23
-
24
-
25
-
26
-
27
-
28
-
29
-
30
-
31
-
32
-
33
-
34
-
35
-
36
-
37
-
38
-
39
-
40
-
41
-
42
-
43
-
44
-
45
-
46
-
47
-
48
-
49
-
50
-
51
-
52
-
53
-
54
-
55
-
56
-
57
-
58
-
59
-
60
-
 61
61 -
 62
62 -
 63
63 -
 64
64 -
 65
65 -
 66
66 -
 67
67 -
 68
68 -
 69
69 -
 70
70 -
 71
71 -
 72
72 -
 73
73 -
 74
74 -
 75
75 -
 76
76 -
 77
77 -
 78
78 -
 79
79 -
 80
80 -
 81
81 -
82
-
83
-
84
-
85
-
86
-
87
-
88
-
89
-
90
-
91
-
92
-
93
-
94
-
95
-
96
-
97
-
98
-
99
-
100
-
101
-
102
-
103
-
104
 |
 |

GROUP FINANCIAL
STATEMENTS
Notes to the Group financial statements 69
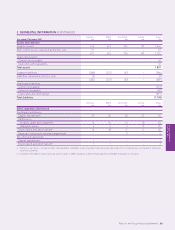
12 GOODWILL (CONTINUED)
Americas managed operations
The Group prepares cash flow forecasts derived from the most recent financial budgets approved by management for the next year
and extrapolates cash flows for the following four years based on an estimated growth rate of 4.0% (2006 4.0%). After this period, the
terminal value of future cash flows is calculated based on a perpetual growth rate of approximately 2.7% (2006 3.0%). The rate used
to discount the forecast cash flows is 10.0% (2006 10.5%).
Asia Pacific managed and franchised operations
The Group prepares cash flow forecasts derived from the most recent financial budgets approved by management for the next year
and extrapolates cash flows for the following four years based on an estimated growth rate of 15.0% (2006 15.0%). After this period,
the terminal value of future cash flows is calculated based on a perpetual growth rate of approximately 4.0% (2006 4.0%). The rate
used to discount the forecast cash flows is 11.0% (2006 11.0%).
With regard to the assessment of value in use, management believe that the carrying values of the CGUs would only exceed their
recoverable amounts in the event of highly unlikely changes in the key assumptions.
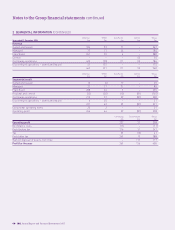
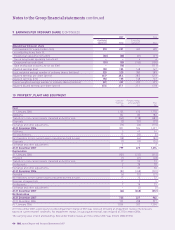
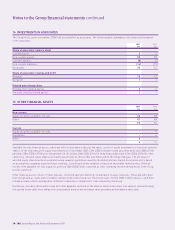
13 INTANGIBLE ASSETS
Management Other
Software contracts intangibles Total
£m £m £m £m
Cost
At 1 January 2006 38 84 28 150
Additions 10 30 13 53
Acquisition of subsidiary 17–8
Disposals – – (2) (2)
Exchange and other adjustments (6) (4) (3) (13)
At 31 December 2006 43 117 36 196
Additions 135725
Reclassification 5––5
Disposals – – (1) (1)
Exchange and other adjustments (1) 2 – 1
At 31 December 2007 60 124 42 226
Amortisation
At 1 January 2006 (17) (3) (10) (30)
Provided (9) (4) (3) (16)
Exchange and other adjustments 3–14
At 31 December 2006 (23) (7) (12) (42)
Provided (9) (6) (4) (19)
Disposals ––11
Exchange and other adjustments 1––1
At 31 December 2007 (31) (13) (15) (59)
Net book value
At 31 December 2007 29 111 27 167
At 31 December 2006 20 110 24 154
At 1 January 2006 21 81 18 120
The weighted average remaining amortisation period for management contracts is 24 years (2006 24 years).
GROUP FINANCIAL
STATEMENTS