Holiday Inn 2007 Annual Report Download - page 77
Download and view the complete annual report
Please find page 77 of the 2007 Holiday Inn annual report below. You can navigate through the pages in the report by either clicking on the pages listed below, or by using the keyword search tool below to find specific information within the annual report.-
 1
1 -
2
-
3
-
4
-
5
-
6
-
7
-
8
-
9
-
10
-
11
-
12
-
13
-
14
-
15
-
16
-
17
-
18
-
19
-
20
-
21
-
22
-
23
-
24
-
25
-
26
-
27
-
28
-
29
-
30
-
31
-
32
-
33
-
34
-
35
-
36
-
37
-
38
-
39
-
40
-
41
-
42
-
43
-
44
-
45
-
46
-
47
-
48
-
49
-
50
-
51
-
52
-
53
-
54
-
55
-
56
-
57
-
58
-
59
-
60
-
61
-
62
-
63
-
64
-
65
-
66
-
 67
67 -
 68
68 -
 69
69 -
 70
70 -
 71
71 -
 72
72 -
 73
73 -
 74
74 -
 75
75 -
 76
76 -
 77
77 -
 78
78 -
 79
79 -
 80
80 -
 81
81 -
 82
82 -
 83
83 -
 84
84 -
 85
85 -
 86
86 -
 87
87 -
88
-
89
-
90
-
91
-
92
-
93
-
94
-
95
-
96
-
97
-
98
-
99
-
100
-
101
-
102
-
103
-
104
 |
 |

GROUP FINANCIAL
STATEMENTS
GROUP FINANCIAL
STATEMENTS
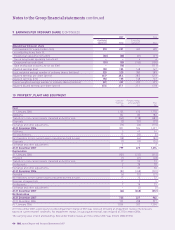
Notes to the Group financial statements 75
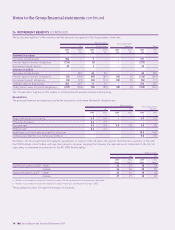
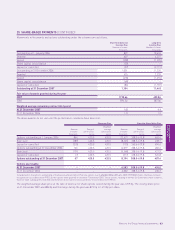
22 FINANCIAL INSTRUMENTS
Liquidity risk
The following are the undiscounted contractual cash flows of financial liabilities, including interest payments.
Less than Between 1 and Between 2 and More than
1 year 2 years 5 years 5 years Total
£m £m £m £m £m
31 December 2007
Secured bank loans 114–6
Finance lease obligations 8 8 24 1,689 1,729
Unsecured bank loans 781 – – – 781
Trade and other payables 388 64 50 55 557
Derivatives 6–––6
Less than Between 1 and Between 2 and More than
1 year 2 years 5 years 5 years Total
£m £m £m £m £m
31 December 2006
Secured bank loans 4 1 5 – 10
Finance lease obligations 3 8 25 1,745 1,781
Unsecured bank loans 214 – – – 214
Trade and other payables 402 47 36 53 538
Derivatives 57 – – – 57
Cash flows relating to unsecured bank loans are classified according to the maturity date of the loan drawdown rather than the facility
maturity date.
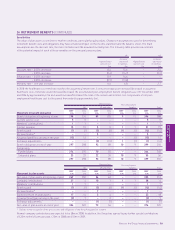
Credit risk
The carrying amount of financial assets represents the maximum exposure to credit risk.
2007 2006
£m £m
Equity securities available-for-sale 46 57
Loans and receivables:
Cash and cash equivalents 52 179
Other financial assets 56 48
Trade and other receivables, excluding prepayments 209 214
Derivatives –4
363 502
Interest rate risk
For each class of interest bearing financial asset and financial liability, the following table indicates the range of interest rates effective at
the balance sheet date, the carrying amount on the balance sheet and the periods in which they reprice, if earlier than the maturity date.
Repricing analysis
Effective Total Between
interest carrying Less than 6 months Between 1 and More than
rate amount 6 months and 1 year 2 years 5 years
%£m£m£m£m£m
31 December 2007
Cash and cash equivalents 0.0-5.9 (52) (52) – – –
Secured bank loans 8.233–––
Finance lease obligations* 9.7 100 – – – 100
Unsecured bank loans:
Euro floating rate 5.3 121 121 – – –
– effect of euro interest rate swaps* (0.6) – (55) – 55 –
US dollar floating rate 5.5 333 333 – – –
– effect of US dollar interest rate swaps* (0.4) – (50) 50 – –
Sterling floating rate 6.9 275 275 – – –
– effect of sterling interest rate swaps 0.0 – (75) – 75 –
HK dollar floating rate 4.54545 – – –
Net debt 825 545 50 130 100
* These items bear interest at a fixed rate.