Holiday Inn 2007 Annual Report Download - page 81
Download and view the complete annual report
Please find page 81 of the 2007 Holiday Inn annual report below. You can navigate through the pages in the report by either clicking on the pages listed below, or by using the keyword search tool below to find specific information within the annual report.-
 1
1 -
2
-
3
-
4
-
5
-
6
-
7
-
8
-
9
-
10
-
11
-
12
-
13
-
14
-
15
-
16
-
17
-
18
-
19
-
20
-
21
-
22
-
23
-
24
-
25
-
26
-
27
-
28
-
29
-
30
-
31
-
32
-
33
-
34
-
35
-
36
-
37
-
38
-
39
-
40
-
41
-
42
-
43
-
44
-
45
-
46
-
47
-
48
-
49
-
50
-
51
-
52
-
53
-
54
-
55
-
56
-
57
-
58
-
59
-
60
-
61
-
62
-
63
-
64
-
65
-
66
-
67
-
68
-
69
-
70
-
 71
71 -
 72
72 -
 73
73 -
 74
74 -
 75
75 -
 76
76 -
 77
77 -
 78
78 -
 79
79 -
 80
80 -
 81
81 -
 82
82 -
 83
83 -
 84
84 -
 85
85 -
 86
86 -
 87
87 -
 88
88 -
 89
89 -
 90
90 -
 91
91 -
92
-
93
-
94
-
95
-
96
-
97
-
98
-
99
-
100
-
101
-
102
-
103
-
104
 |
 |

GROUP FINANCIAL
STATEMENTS
Notes to the Group financial statements 79
GROUP FINANCIAL
STATEMENTS
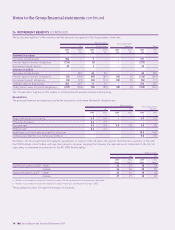
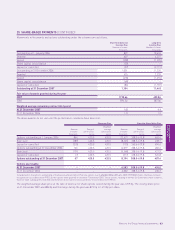
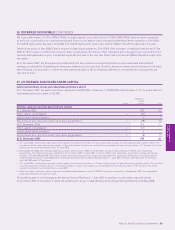
24 RETIREMENT BENEFITS (CONTINUED)
Sensitivities
The value of plan assets is sensitive to market conditions, particularly equity values. Changes in assumptions used for determining
retirement benefit costs and obligations may have a material impact on the income statement and the balance sheet. The main
assumptions are the discount rate, the rate of inflation and the assumed mortality rate. The following table provides an estimate
of the potential impact of each of these variables on the principal pension plans.
UK US
Increase/ Increase/
Higher/(lower) (decrease) Higher/(lower) (decrease)
pension cost in liabilities pension cost in liabilities
£m £m £m £m
Discount rate – 0.25% decrease 0.4 15.6 – 2.4
– 0.25% increase (0.4) (14.7) – (2.3)
Inflation rate – 0.25% increase 0.9 14.6 – –
– 0.25% decrease (0.9) (13.8) – –
Mortality rate – one year increase 0.6 6.8 – 2.7
In 2018 the healthcare cost trend rate reaches the assumed ultimate rate. A one percentage point increase/(decrease) in assumed
healthcare costs trend rate would increase/(decrease) the accumulated post-employment benefit obligations as of 31 December 2007
and 2006 by approximately £1m and would increase/(decrease) the total of the service and interest cost components of net post-
employment healthcare cost for the period then ended by approximately £nil.
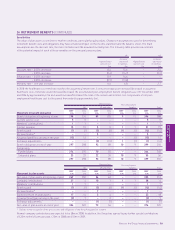
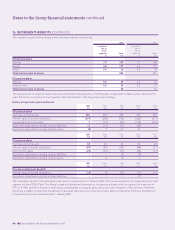
Pension plans Post-employment
UK US and other benefits Total
2007 2006 2007 2006 2007 2006 2007 2006
Movement in benefit obligation £m £m £m £m £m £m £m £m
Benefit obligation at beginning of year 298 274 89 103 911 396 388
Current service cost 55––––55
Members’ contributions 11––––11
Interest expense 15 13 551121 19
Benefits paid (7) (7) (5) (6) (1) (1) (13) (14)
Reclassification* ––5–––5–
Actuarial (gain)/loss arising in the year (15) 12 –––(1) (15) 11
Exchange adjustments ––(2) (13) 1(1) (1) (14)
Benefit obligation at end of year 297 298 92 89 10 9399 396
Comprising:
Funded plans 274 275 70 65 ––344 340
Unfunded plans 23 23 22 24 10 955 56
297 298 92 89 10 9399 396
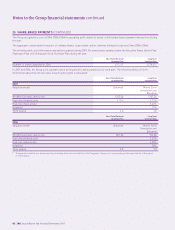
Pension plans Post-employment
UK US and other benefits Total
2007 2006 2007 2006 2007 2006 2007 2006
Movement in plan assets £m £m £m £m £m £m £m £m
Fair value of plan assets at beginning of year 269 250 56 62 ––325 312
Company contributions 27 410 11138 6
Members’ contributions 11––––11
Benefits paid (7) (7) (5) (6) (1) (1) (13) (14)
Reclassification* ––7–––7–
Expected return on plan assets 17 14 54––22 18
Actuarial (loss)/gain arising in the year (3) 7–2––(3) 9
Exchange adjustments ––(1) (7) ––(1) (7)
Fair value of plan assets at end of year 304 269 72 56 ––376 325
* Relates to the recognition of the gross assets and obligations of the Hong Kong pension scheme.
Normal company contributions are expected to be £8m in 2008. In addition, the Group has agreed to pay further special contributions
of £20m to the UK pension plan; £10m in 2008 and £10m in 2009.