Holiday Inn 2007 Annual Report Download - page 85
Download and view the complete annual report
Please find page 85 of the 2007 Holiday Inn annual report below. You can navigate through the pages in the report by either clicking on the pages listed below, or by using the keyword search tool below to find specific information within the annual report.-
 1
1 -
2
-
3
-
4
-
5
-
6
-
7
-
8
-
9
-
10
-
11
-
12
-
13
-
14
-
15
-
16
-
17
-
18
-
19
-
20
-
21
-
22
-
23
-
24
-
25
-
26
-
27
-
28
-
29
-
30
-
31
-
32
-
33
-
34
-
35
-
36
-
37
-
38
-
39
-
40
-
41
-
42
-
43
-
44
-
45
-
46
-
47
-
48
-
49
-
50
-
51
-
52
-
53
-
54
-
55
-
56
-
57
-
58
-
59
-
60
-
61
-
62
-
63
-
64
-
65
-
66
-
67
-
68
-
69
-
70
-
71
-
72
-
73
-
74
-
 75
75 -
 76
76 -
 77
77 -
 78
78 -
 79
79 -
 80
80 -
 81
81 -
 82
82 -
 83
83 -
 84
84 -
 85
85 -
 86
86 -
 87
87 -
 88
88 -
 89
89 -
 90
90 -
 91
91 -
 92
92 -
 93
93 -
 94
94 -
 95
95 -
96
-
97
-
98
-
99
-
100
-
101
-
102
-
103
-
104
 |
 |

GROUP FINANCIAL
STATEMENTS
Notes to the Group financial statements 83
GROUP FINANCIAL
STATEMENTS
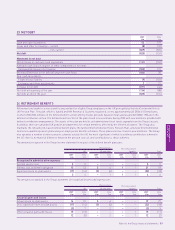
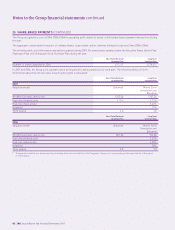
25 SHARE-BASED PAYMENTS (CONTINUED)
Movements in the awards and options outstanding under the schemes are as follows:
Short Term Deferred Long Term
Incentive Plan Incentive Plan
Number of shares Number of shares
thousands thousands
Outstanding at 1 January 2006 829 10,634
Granted 607 4,277
Vested (328) (1,395)
Share capital consolidation (50) –
Lapsed or cancelled (57) (2,191)
Outstanding at 31 December 2006 1,001 11,325
Granted 675 3,539
Vested (418) (1,694)
Share capital consolidation (68) –
Lapsed or cancelled (86) (1,707)
Outstanding at 31 December 2007 1,104 11,463
Fair value of awards granted during the year
2007 1190.6p 453.8p
2006 894.5p 287.0p
Weighted average remaining contract life (years)
At 31 December 2007 1.5 1.1
At 31 December 2006 1.0 1.3
The above awards do not vest until the performance conditions have been met.
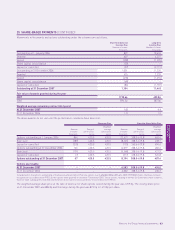
Sharesave Plan Executive Share Option Plan
Weighted Weighted
Number Range of average Number Range of average
of shares option prices option price of shares option prices option price
thousands pence pence thousands pence pence
Options outstanding at 1 January 2006 864 420.5 420.5 22,619 308.5-619.8 465.4
Exercised (389) 420.5 420.5 (8,365) 308.5-619.8 438.7
Lapsed or cancelled (310) 420.5 420.5 (175) 345.6-619.8 404.6
Options outstanding at 31 December 2006 165 420.5 420.5 14,079 308.5-619.8 482.2
Exercised (101) 420.5 420.5 (5,568) 308.5-619.8 471.9
Lapsed or cancelled (7) 420.5 420.5 (317) 438.0-619.8 526.8
Options outstanding at 31 December 2007 57 420.5 420.5 8,194 308.5-619.8 487.4
Options exercisable
At 31 December 2007 – – – 6,583 308.5-619.8 455.0
At 31 December 2006 – – – 6,002 308.5-619.8 430.2
Included within the options outstanding of the Executive Share Option Plan are options over 2,696,883 (2006 4,055,674; 2005 7,909,002) shares that have not been
recognised in accordance with IFRS 2 as the options were granted on or before 7 November 2002. These options, relating to former Six Continents share schemes,
have not been subsequently modified and therefore do not need to be accounted for in accordance with IFRS 2.
The weighted average share price at the date of exercise for share options vested during the year was 1259.0p. The closing share price
on 31 December 2007 was 884.0p and the range during the year was 873.5p to 1413.0p per share.