Holiday Inn 2007 Annual Report Download - page 50
Download and view the complete annual report
Please find page 50 of the 2007 Holiday Inn annual report below. You can navigate through the pages in the report by either clicking on the pages listed below, or by using the keyword search tool below to find specific information within the annual report.-
 1
1 -
2
-
3
-
4
-
5
-
6
-
7
-
8
-
9
-
10
-
11
-
12
-
13
-
14
-
15
-
16
-
17
-
18
-
19
-
20
-
21
-
22
-
23
-
24
-
25
-
26
-
27
-
28
-
29
-
30
-
31
-
32
-
33
-
34
-
35
-
36
-
37
-
38
-
39
-
 40
40 -
 41
41 -
 42
42 -
 43
43 -
 44
44 -
 45
45 -
 46
46 -
 47
47 -
 48
48 -
 49
49 -
 50
50 -
 51
51 -
 52
52 -
 53
53 -
 54
54 -
 55
55 -
 56
56 -
 57
57 -
 58
58 -
 59
59 -
 60
60 -
61
-
62
-
63
-
64
-
65
-
66
-
67
-
68
-
69
-
70
-
71
-
72
-
73
-
74
-
75
-
76
-
77
-
78
-
79
-
80
-
81
-
82
-
83
-
84
-
85
-
86
-
87
-
88
-
89
-
90
-
91
-
92
-
93
-
94
-
95
-
96
-
97
-
98
-
99
-
100
-
101
-
102
-
103
-
104
 |
 |

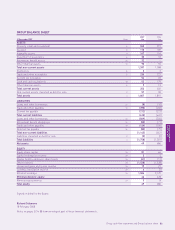
48 IHG Annual Report and Financial Statements 2007
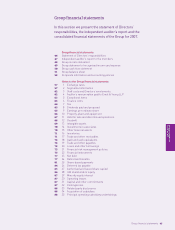
Group financial statements
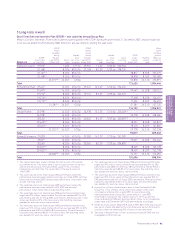
GROUP INCOME STATEMENT
2007 2006
Before Exceptional Before Exceptional
exceptional items exceptional items
items (note 5) Total items (note 5) Total
For the year ended 31 December 2007 Note £m £m £m £m £m £m
Revenue 2883 – 883 786 – 786
Cost of sales (411) – (411) (355) – (355)
Administrative expenses (188) (7) (195) (180) – (180)
Other operating income and expenses 83846 42731
292 31 323 255 27 282
Depreciation and amortisation 2(55) (1) (56) (55) – (55)
Operating profit 2237 30 267 200 27 227
Financial income 69–926 – 26
Financial expenses 6(54) – (54) (37) – (37)
Profit before tax 192 30 222 189 27 216
Tax 7(42) 30 (12) (41) 94 53
Profit for the year from continuing operations 150 60 210 148 121 269
Profit for the year from discontinued operations 11 5162119 117 136
Profit for the year attributable to the equity holders
of the parent 155 76 231 167 238 405
Earnings per ordinary share 9
Continuing operations:
Basic 65.6p 69.1p
Diluted 63.8p 67.4p
Adjusted 46.9p 38.0p
Adjusted diluted 45.6p 37.1p
Total operations:
Basic 72.2p 104.1p
Diluted 70.2p 101.5p
Adjusted 48.4p 42.9p
Adjusted diluted 47.1p 41.8p
Notes on pages 52 to 88 form an integral part of these financial statements.