Holiday Inn 2007 Annual Report Download - page 44
Download and view the complete annual report
Please find page 44 of the 2007 Holiday Inn annual report below. You can navigate through the pages in the report by either clicking on the pages listed below, or by using the keyword search tool below to find specific information within the annual report.-
 1
1 -
2
-
3
-
4
-
5
-
6
-
7
-
8
-
9
-
10
-
11
-
12
-
13
-
14
-
15
-
16
-
17
-
18
-
19
-
20
-
21
-
22
-
23
-
24
-
25
-
26
-
27
-
28
-
29
-
30
-
31
-
32
-
33
-
 34
34 -
 35
35 -
 36
36 -
 37
37 -
 38
38 -
 39
39 -
 40
40 -
 41
41 -
 42
42 -
 43
43 -
 44
44 -
 45
45 -
 46
46 -
 47
47 -
 48
48 -
 49
49 -
 50
50 -
 51
51 -
 52
52 -
 53
53 -
 54
54 -
55
-
56
-
57
-
58
-
59
-
60
-
61
-
62
-
63
-
64
-
65
-
66
-
67
-
68
-
69
-
70
-
71
-
72
-
73
-
74
-
75
-
76
-
77
-
78
-
79
-
80
-
81
-
82
-
83
-
84
-
85
-
86
-
87
-
88
-
89
-
90
-
91
-
92
-
93
-
94
-
95
-
96
-
97
-
98
-
99
-
100
-
101
-
102
-
103
-
104
 |
 |

42 IHG Annual Report and Financial Statements 2007
Remuneration report continued
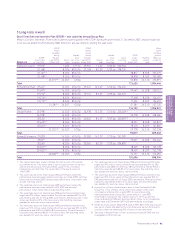
Long Term Incentive Plan (LTIP) – previously called the Performance Restricted Share Plan
In 2007, there were three cycles in operation and one cycle which vested.
The awards made in respect of cycles ending on 31 December 2006, 2007, 2008 and 2009 and the maximum pre-tax number
of ordinary shares due if performance targets are achieved in full are set out in the table below. In respect of the cycle ending on
31 December 2007, the Company finished in fourth place in the TSR group and achieved a relative cumulative annual rooms growth
(CAGR) of 3.1%. Accordingly, 55.3% of the award will vest on 20 February 2008.
Maximum Maximum Expected
LTIP LTIP value value
shares shares based based
Maximum awarded vested on share on share
LTIP during Market during Market Actual/ Maximum price of price of
shares the year price per the year price per Value at planned LTIP shares 884.0p at 884.0p at
held at 1 Jan 2007 to Award share at 1 Jan 2007 to share at vesting vesting held at 31 Dec 2007 31 Dec 2007
Directors 1 Jan 2007 31 Dec 2007 date award 31 Dec 2007 vesting £ date 31 Dec 2007 £ £
Andrew Cosslett 136,43211.4.05 617.5p 85,133 1249p 1,063,311 21.2.07 –
276,200229.6.05 706p – 20.2.08 276,200 2,441,608 1,350,0108
200,74033.4.06 941.5p – 18.2.09 200,740 1,774,542
159,50642.4.07 1256p – 17.2.10 159,506 1,410,034
Total 636,446 5,626,184
Richard Hartman 165,130124.6.04 549.5p 103,041 1249p 1,286,982 21.2.07 –
214,870229.6.05 706p – 20.2.08 196,96451,741,162 962,8638
146,11033.4.06 941.5p – 18.2.09 85,2305753,434
113,73142.4.07 1256p – 17.2.10 28,4325251,339
Total 310,626 2,745,935
Stevan Porter 142,290124.6.04 549.5p 88,788 1249p 1,108,962621.2.07 –
174,900229.6.05 706p – 20.2.08 174,900 1,546,116 855,0038
132,24033.4.06 941.5p – 18.2.09 132,240 1,169,002
92,66742.4.07 1256p – 17.2.10 92,667 819,177
Total 399,807 3,534,295
Richard Solomons 144,990124.6.04 549.5p 90,473 1249p 1,130,008 21.2.07 –
176,550229.6.05 706p – 20.2.08 176,550 1,560,702 863,0698
128,47033.4.06 941.5p – 18.2.09 128,470 1,135,675
102,10942.4.07 1256p – 17.2.10 102,109 902,644
Total 407,129 3,599,021
Former Directors
Richard North 144,9931,7 24.6.04 549.5p 90,475 1249p 1,130,033 21.2.07 –
Total –
1 This award was based on performance to 31 December 2006 where the
performance measure related to both the Company's TSR against a group
of eight other comparator companies and growth in return on capital
employed (ROCE). The number of shares released was graded, according to
a) where the Company finished in the TSR comparator group, with 50% of
the award being released for first or second position and 10% of the award
being released for fifth place; and b) growth in ROCE, with 50% of the
award being released for 141.6% growth and 10% of the award being
released for 70% growth. The Company finished in third place in the TSR
group and achieved ROCE growth of 98.2%. Accordingly, 62.4% of the award
vested on 21 February 2007.
2 This award is based on performance to 31 December 2007 where the
performance measure relates to both the Company’s TSR against a group
of seven other comparator companies and the cumulative annual growth
rate (CAGR) of rooms in the IHG system relative to a group of five other
comparator companies. The number of shares released is graded,
according to a) where the Company finished in the TSR comparator group,
with 50% of the award being released for first or second position and 10%
of the award being released for median position; and b) relative CAGR with
50% of the award being released for 3.4% (upper quartile) CAGR and 10%
of the award being released for 2.4% (median) CAGR.
3 This award is based on performance to 31 December 2008 where the
performance measure relates to both the Company’s TSR against a group
of eight other comparator companies and the relative CAGR of rooms in
the IHG system.
4 This award is based on performance to 31 December 2009 where the
performance measure relates to both the Company's TSR against a group
of eight other comparator companies and the compound annual growth
rate in earnings per share (EPS) over the performance period.
5 Richard Hartman’s awards were pro-rated to reflect his contractual service
during the applicable performance periods.
6 The value of Stevan Porter’s shares at vesting includes £129,378 that was
chargeable to UK income tax.
7 Richard North’s award was pro-rated to reflect his contractual service
during the applicable performance period.
8 The Company finished in fourth place in the TSR group and achieved CAGR
of 3.1%. Accordingly, 55.3% of the award will vest on 20 February 2008.