Holiday Inn 2007 Annual Report Download - page 18
Download and view the complete annual report
Please find page 18 of the 2007 Holiday Inn annual report below. You can navigate through the pages in the report by either clicking on the pages listed below, or by using the keyword search tool below to find specific information within the annual report.-
 1
1 -
2
-
3
-
4
-
5
-
6
-
7
-
 8
8 -
 9
9 -
 10
10 -
 11
11 -
 12
12 -
 13
13 -
 14
14 -
 15
15 -
 16
16 -
 17
17 -
 18
18 -
 19
19 -
 20
20 -
 21
21 -
 22
22 -
 23
23 -
 24
24 -
 25
25 -
 26
26 -
 27
27 -
 28
28 -
29
-
30
-
31
-
32
-
33
-
34
-
35
-
36
-
37
-
38
-
39
-
40
-
41
-
42
-
43
-
44
-
45
-
46
-
47
-
48
-
49
-
50
-
51
-
52
-
53
-
54
-
55
-
56
-
57
-
58
-
59
-
60
-
61
-
62
-
63
-
64
-
65
-
66
-
67
-
68
-
69
-
70
-
71
-
72
-
73
-
74
-
75
-
76
-
77
-
78
-
79
-
80
-
81
-
82
-
83
-
84
-
85
-
86
-
87
-
88
-
89
-
90
-
91
-
92
-
93
-
94
-
95
-
96
-
97
-
98
-
99
-
100
-
101
-
102
-
103
-
104
 |
 |

16 IHG Annual Report and Financial Statements 2007
Business review continued
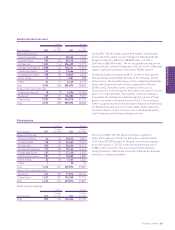
12 months ended 31 December
2007 2006 %
£m £m change
Revenue
Owned and leased 121 92 31.5
Managed 84 71 18.3
Franchised 40 35 14.3
Continuing operations 245 198 23.7
Discontinued operations* 9133 (93.2)
Total £m 254 331 (23.3)
Dollar equivalent $m 509 608 (16.3)
Operating profit before exceptional items
Owned and leased 17 (4) 525.0
Managed 43 37 16.2
Franchised 29 24 20.8
89 57 56.1
Regional overheads (22) (20) (10.0)
Continuing operations 67 37 81.1
Discontinued operations* –25 –
Total £m 67 62 8.1
Dollar equivalent $m 135 114 18.4
* Discontinued operations are all owned and leased.
Revenue and operating profit from continuing operations
increased by 23.7% to £245m and 81.1% to £67m respectively.
Including discontinued operations, revenue decreased by 23.3%
whilst operating profit increased by 8.1%, reflecting the impact
of hotels sold and converted to management and franchise
contracts over the past two years.
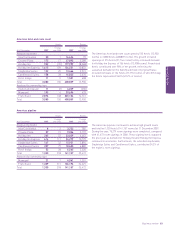
During the year, the region achieved RevPAR growth of 8.6%
driven by substantial gains across all brands and ownership types.
From a regional perspective, RevPAR levels benefited from the
positive market conditions in the Middle East, France and the UK.
The region’s continuing operating profit margins increased by
8.6 percentage points to 27.3% as a result of improved revenue
conversion in the owned and leased portfolio and increased
scalability in the franchised operations.
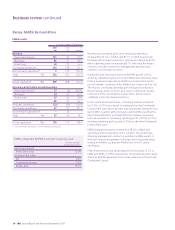
In the owned and leased estate, continuing revenue increased
by 31.5% to £121m as a result of trading at the InterContinental
London Park Lane which became fully operational during the first
half of 2007, together with strong rate-led RevPAR growth at the
InterContinental Paris Le Grand. Effective revenue conversion
led to an increase in continuing operating profit of £21m to £17m,
including operating profit growth of £14m at the InterContinental
London Park Lane.
EMEA managed revenues increased by 18.3% to £84m and
operating profit increased by 16.2% to £43m. The growth was
driven by management contracts negotiated in 2006 as part of
the hotel disposal programme in Europe and strong underlying
trading in markets such as the Middle East, the UK, Spain
and Russia.
Franchised revenue and operating profit increased by 14.3% to
£40m and 20.8% to £29m respectively. The growth was principally
driven by RevPAR gains and room count expansion in the UK and
Continental Europe.
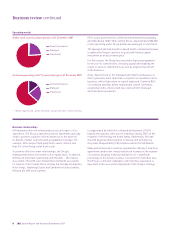
Europe, Middle East and Africa
EMEA results
EMEA comparable RevPAR movement on previous year
12 months ended
31 December 2007
Owned and leased
InterContinental 14.0%
All ownership types
UK 6.2%
Continental Europe 7.6%
Middle East 19.6%