Harley Davidson 2014 Annual Report Download - page 97
Download and view the complete annual report
Please find page 97 of the 2014 Harley Davidson annual report below. You can navigate through the pages in the report by either clicking on the pages listed below, or by using the keyword search tool below to find specific information within the annual report.-
 1
1 -
2
-
3
-
4
-
5
-
6
-
7
-
8
-
9
-
10
-
11
-
12
-
13
-
14
-
15
-
16
-
17
-
18
-
19
-
20
-
21
-
22
-
23
-
24
-
25
-
26
-
27
-
28
-
29
-
30
-
31
-
32
-
33
-
34
-
35
-
36
-
37
-
38
-
39
-
40
-
41
-
42
-
43
-
44
-
45
-
46
-
47
-
48
-
49
-
50
-
51
-
52
-
53
-
54
-
55
-
56
-
57
-
58
-
59
-
60
-
61
-
62
-
63
-
64
-
65
-
66
-
67
-
68
-
69
-
70
-
71
-
72
-
73
-
74
-
75
-
76
-
77
-
78
-
79
-
80
-
81
-
82
-
83
-
84
-
85
-
86
-
 87
87 -
 88
88 -
 89
89 -
 90
90 -
 91
91 -
 92
92 -
 93
93 -
 94
94 -
 95
95 -
 96
96 -
 97
97 -
 98
98 -
 99
99 -
 100
100 -
 101
101 -
 102
102 -
 103
103 -
 104
104 -
 105
105 -
 106
106 -
 107
107 -
108
-
109
-
110
-
111
-
112
-
113
-
114
-
115
-
116
-
117
 |
 |

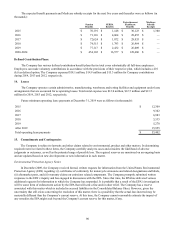
20.€€€€Related Party Transactions
A director of the Company is Chairman and Chief Executive Officer and an equity owner of Fred Deeley Imports Ltd.
(Deeley Imports), the exclusive distributor of the Company’s motorcycles in Canada. The Company recorded motorcycles and
related products revenue and financial services revenue from Deeley Imports during 2014, 2013 and 2012 of $194.8 million,
$204.8 million and $187.1 million, respectively, and had finance receivables balances due from Deeley Imports of $7.4 million,
$11.5 million and $9.2 million at December€31, 2014, 2013 and 2012, respectively. All such products were provided in the
ordinary course of business at prices and on terms and conditions that the Company believes are the same as those that would
result from arm’s-length negotiations between unrelated parties.
97
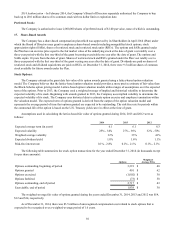
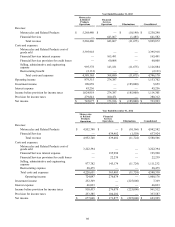
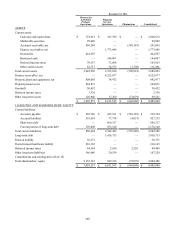
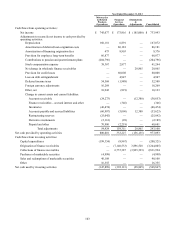
21.€€€€Supplemental Consolidating Data
The supplemental consolidating data for the periods noted is presented for informational purposes. The supplemental
consolidating data may be different than segment information presented elsewhere due to the allocation of intercompany
eliminations to reporting segments. All supplemental data is presented in thousands.€
Year Ended December 31, 2014
Motorcycles
& Related
Products
Operations
Financial
Services
Operations Eliminations Consolidated
Revenue:
Motorcycles and Related Products $5,577,697 $—$(10,016) $ 5,567,681
Financial Services — 662,345 (1,518)660,827
Total revenue 5,577,697 662,345 (11,534)6,228,508
Costs and expenses:
Motorcycles and Related Products cost of
goods sold 3,542,601 — — 3,542,601
Financial Services interest expense — 164,476 — 164,476
Financial Services provision for credit losses — 80,946 — 80,946
Selling, administrative and engineering
expense
1,023,450 147,586 (11,534)1,159,502
Total costs and expenses 4,566,051 393,008 (11,534)4,947,525
Operating income 1,011,646 269,337 — 1,280,983
Investment income 126,499 — (120,000)6,499
Interest expense 4,162 — — 4,162
Income before provision for income taxes 1,133,983 269,337 (120,000)1,283,320
Provision for income taxes 338,453 100,256 — 438,709
Net income $795,530 $169,081 $(120,000) $ 844,611