Harley Davidson 2014 Annual Report Download - page 33
Download and view the complete annual report
Please find page 33 of the 2014 Harley Davidson annual report below. You can navigate through the pages in the report by either clicking on the pages listed below, or by using the keyword search tool below to find specific information within the annual report.-
 1
1 -
2
-
3
-
4
-
5
-
6
-
7
-
8
-
9
-
10
-
11
-
12
-
13
-
14
-
15
-
16
-
17
-
18
-
19
-
20
-
21
-
22
-
 23
23 -
 24
24 -
 25
25 -
 26
26 -
 27
27 -
 28
28 -
 29
29 -
 30
30 -
 31
31 -
 32
32 -
 33
33 -
 34
34 -
 35
35 -
 36
36 -
 37
37 -
 38
38 -
 39
39 -
 40
40 -
 41
41 -
 42
42 -
 43
43 -
44
-
45
-
46
-
47
-
48
-
49
-
50
-
51
-
52
-
53
-
54
-
55
-
56
-
57
-
58
-
59
-
60
-
61
-
62
-
63
-
64
-
65
-
66
-
67
-
68
-
69
-
70
-
71
-
72
-
73
-
74
-
75
-
76
-
77
-
78
-
79
-
80
-
81
-
82
-
83
-
84
-
85
-
86
-
87
-
88
-
89
-
90
-
91
-
92
-
93
-
94
-
95
-
96
-
97
-
98
-
99
-
100
-
101
-
102
-
103
-
104
-
105
-
106
-
107
-
108
-
109
-
110
-
111
-
112
-
113
-
114
-
115
-
116
-
117
 |
 |

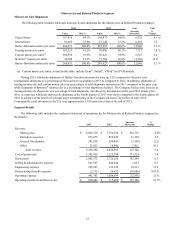
Motorcycles and Related Products Segment
Motorcycle Unit Shipments
The following table includes wholesale motorcycle unit shipments for the Motorcycles & Related Products segment:€
2013 2012 Unit Unit
Units Mix % Units Mix %
Increase
(Decrease)
%
Change
United States 167,016 64.1%160,477 64.8%6,539 4.1 %
International 93,455 35.9%87,148 35.2%6,307 7.2
Harley-Davidson motorcycle units 260,471 100.0%247,625 100.0%12,846 5.2 %
Touring motorcycle units 107,213 41.2%99,496 40.2%7,717 7.8 %
Custom motorcycle units(a) 102,950 39.5%96,425 38.9%6,525 6.8
Sportster® motorcycle units 50,308 19.3%51,704 20.9%(1,396)(2.7)
Harley-Davidson motorcycle units 260,471 100.0%247,625 100.0%12,846 5.2 %
(a) Custom motorcycle units, as used in this table, include Dyna®, Softail®, V-Rod® and CVO models.
During 2013, wholesale shipments of Harley-Davidson motorcycles were up 5.2% compared to the prior year.
International shipments as a percentage of the total were up slightly in 2013 as compared to 2012. In addition, shipments of
touring motorcycles and custom motorcycles as a percentage of total shipments increased in 2013 compared to the prior year
while shipments of Sportster® motorcycles as a percentage of total shipments declined. The Company believes the increase in
touring motorcycle shipments, as a percentage of total shipments, was driven by demand for model-year 2014 motorcycles.
Also, as expected, wholesale motorcycle shipments in the fourth quarter of 2013 were down compared to the fourth quarter of
2012 in advance of the launch of seasonal surge manufacturing at the Company's Kansas City facility in early 2014.
Consequently, retail inventory in the U.S. was approximately 1,850 units lower than at the end of 2012.
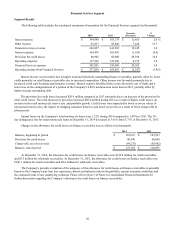
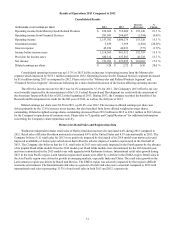
Segment Results
The following table includes the condensed statement of operations for the Motorcycles & Related Products segment (in
thousands):
2013 2012
Increase
(Decrease)
%
Change
Revenue:
Motorcycles $4,067,510 $3,764,794 $302,716 8.0%
Parts€& Accessories 873,075 859,945 13,130 1.5
General Merchandise 295,854 299,403 (3,549)(1.2)
Other 21,851 18,440 3,411 18.5
Total revenue 5,258,290 4,942,582 315,708 6.4
Cost of goods sold 3,395,918 3,222,394 173,524 5.4
Gross profit 1,862,372 1,720,188 142,184 8.3
Selling€& administrative expense 847,927 846,894 1,033 0.1
Engineering expense 145,967 129,330 16,637 12.9
Restructuring (benefit) expense (2,131)28,475 (30,606)(107.5)
Operating expense 991,763 1,004,699 (12,936)(1.3)
Operating income from Motorcycles $870,609 $715,489 $155,120 21.7%
33