Harley Davidson 2014 Annual Report Download - page 93
Download and view the complete annual report
Please find page 93 of the 2014 Harley Davidson annual report below. You can navigate through the pages in the report by either clicking on the pages listed below, or by using the keyword search tool below to find specific information within the annual report.-
 1
1 -
2
-
3
-
4
-
5
-
6
-
7
-
8
-
9
-
10
-
11
-
12
-
13
-
14
-
15
-
16
-
17
-
18
-
19
-
20
-
21
-
22
-
23
-
24
-
25
-
26
-
27
-
28
-
29
-
30
-
31
-
32
-
33
-
34
-
35
-
36
-
37
-
38
-
39
-
40
-
41
-
42
-
43
-
44
-
45
-
46
-
47
-
48
-
49
-
50
-
51
-
52
-
53
-
54
-
55
-
56
-
57
-
58
-
59
-
60
-
61
-
62
-
63
-
64
-
65
-
66
-
67
-
68
-
69
-
70
-
71
-
72
-
73
-
74
-
75
-
76
-
77
-
78
-
79
-
80
-
81
-
82
-
 83
83 -
 84
84 -
 85
85 -
 86
86 -
 87
87 -
 88
88 -
 89
89 -
 90
90 -
 91
91 -
 92
92 -
 93
93 -
 94
94 -
 95
95 -
 96
96 -
 97
97 -
 98
98 -
 99
99 -
 100
100 -
 101
101 -
 102
102 -
 103
103 -
104
-
105
-
106
-
107
-
108
-
109
-
110
-
111
-
112
-
113
-
114
-
115
-
116
-
117
 |
 |

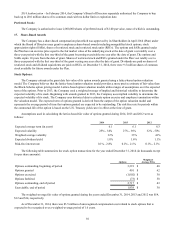
The following table summarizes the aggregate intrinsic value related to options outstanding, exercisable and exercised as
of and for the years ended December€31 (in thousands):€
2014 2013 2012
Exercised $31,623 $28,879 $34,443
Outstanding $61,947 $100,054 $60,963
Exercisable $54,071 $81,930 $35,873
The Company’s policy is to issue new shares of common stock upon the exercise of employee stock options. The
Company has a continuing authorization from its Board of Directors to repurchase shares to offset dilution caused by the
exercise of stock options which is discussed in Note 16.
Stock options outstanding at December€31, 2014 (options in thousands):€
Price Range
Weighted-Average
Contractual Life Options
Weighted-Average
Exercise Price
$10.01 to $20 4.0 409 $13
$20.01 to $30 5.1 233 $23
$30.01 to $40 3.1 262 $39
$40.01 to $50 6.6 659 $44
$50.01 to $60 6.7 494 $52
$60.01 to $70 5.8 660 $64
Options outstanding 5.6 2,717 $43
Options exercisable 4.4 1,938 $38
Stock Appreciation Rights (SARs)
SARs vest under the same terms and conditions as options; however, they are settled in cash equal to their settlement date
fair value. As a result, SARs are recorded in the Company’s consolidated balance sheets as a liability until the date of exercise.
The fair value of each SAR award is estimated using a lattice-based valuation model. In accordance with ASC Topic 718,
“Stock Compensation”, the fair value of each SAR award is recalculated at the end of each reporting period and the liability
and expense adjusted based on the new fair value and the percent vested.
The assumptions used to determine the fair value of the SAR awards at December€31, 2014 and 2013 were as follows:€
2014 2013
Expected average term (in years) 3.7 - 5.4 3.5 - 4.3
Expected volatility 25% - 31% 24% - 32%
Expected dividend yield 1.7%1.2%
Risk-free interest rate 0.0% - 2.3% 0.1% - 3.0%
The following table summarizes the SAR transactions for the year ended December€31, 2014 (in thousands except for per
share amounts):€
SARs
Weighted-Average
Price
Outstanding, beginning of period 210 $26
Granted 12 $62
Exercised (46) $ 20
Forfeited — $—
Outstanding, end of period 176 $30
Exercisable, end of period 148 $25
The weighted-average fair value of SARs granted during the years ended December€31, 2014, 2013 and 2012 was $14,
$12 and $14, respectively.
93