Harley Davidson 2014 Annual Report Download - page 68
Download and view the complete annual report
Please find page 68 of the 2014 Harley Davidson annual report below. You can navigate through the pages in the report by either clicking on the pages listed below, or by using the keyword search tool below to find specific information within the annual report.-
 1
1 -
2
-
3
-
4
-
5
-
6
-
7
-
8
-
9
-
10
-
11
-
12
-
13
-
14
-
15
-
16
-
17
-
18
-
19
-
20
-
21
-
22
-
23
-
24
-
25
-
26
-
27
-
28
-
29
-
30
-
31
-
32
-
33
-
34
-
35
-
36
-
37
-
38
-
39
-
40
-
41
-
42
-
43
-
44
-
45
-
46
-
47
-
48
-
49
-
50
-
51
-
52
-
53
-
54
-
55
-
56
-
57
-
 58
58 -
 59
59 -
 60
60 -
 61
61 -
 62
62 -
 63
63 -
 64
64 -
 65
65 -
 66
66 -
 67
67 -
 68
68 -
 69
69 -
 70
70 -
 71
71 -
 72
72 -
 73
73 -
 74
74 -
 75
75 -
 76
76 -
 77
77 -
 78
78 -
79
-
80
-
81
-
82
-
83
-
84
-
85
-
86
-
87
-
88
-
89
-
90
-
91
-
92
-
93
-
94
-
95
-
96
-
97
-
98
-
99
-
100
-
101
-
102
-
103
-
104
-
105
-
106
-
107
-
108
-
109
-
110
-
111
-
112
-
113
-
114
-
115
-
116
-
117
 |
 |

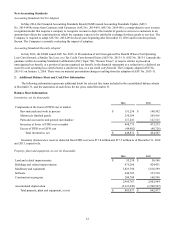
2014
Retail Wholesale Total
Allowance for credit losses, ending balance:
Individually evaluated for impairment $—$—$—
Collectively evaluated for impairment 122,025 5,339 127,364
Total allowance for credit losses $122,025 $5,339 $127,364
Finance receivables, ending balance:
Individually evaluated for impairment $—$—$—
Collectively evaluated for impairment 5,607,924 952,321 6,560,245
Total finance receivables $5,607,924 $952,321 $6,560,245
2013
Retail Wholesale Total
Allowance for credit losses, ending balance:
Individually evaluated for impairment $—$—$—
Collectively evaluated for impairment 106,063 4,630 110,693
Total allowance for credit losses $106,063 $4,630 $110,693
Finance receivables, ending balance:
Individually evaluated for impairment $—$—$—
Collectively evaluated for impairment 5,265,044 845,212 6,110,256
Total finance receivables $5,265,044 $845,212 $6,110,256
Finance receivables are considered impaired when management determines it is probable that the Company will be
unable to collect all amounts due according to the loan agreement. As retail finance receivables are collectively and not
individually reviewed for impairment, this portfolio does not have specifically impaired finance receivables. At December€31,
2014 and 2013, there were no wholesale finance receivables that were on non-accrual status or individually deemed to be
impaired under ASC Topic 310, “Receivables”.
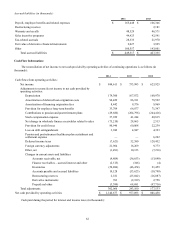
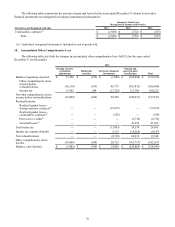
An analysis of the aging of past due finance receivables at December€31 was as follows (in thousands):€
2014
Current
31-60€Days
Past Due
61-90€Days
Past Due
Greater€than
90 Days
Past Due
Total
Past Due
Total
Finance
Receivables
Retail $5,427,719 $113,007 $38,486 $28,712 $180,205 $5,607,924
Wholesale 951,660 383 72 206 661 952,321
Total $6,379,379 $113,390 $38,558 $28,918 $180,866 $6,560,245
2013
Current
31-60€Days
Past Due
61-90€Days
Past Due
Greater€than
90 Days
Past Due
Total
Past Due
Total
Finance
Receivables
Retail $5,094,615 $109,806 $36,029 $24,594 $170,429 $5,265,044
Wholesale 844,033 791 181 207 1,179 845,212
Total $5,938,648 $110,597 $36,210 $24,801 $171,608 $6,110,256
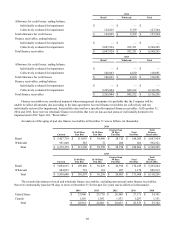
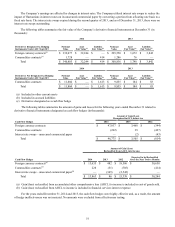
The recorded investment of retail and wholesale finance receivables, excluding non-accrual status finance receivables,
that were contractually past due 90 days or more at December€31 for the past five years was as follows (in thousands):€
2014 2013 2012 2011 2010
United States $27,800 $23,770 $26,500 $27,171 $34,391
Canada 1,118 1,031 1,533 1,207 1,351
Total $28,918 $24,801 $28,033 $28,378 $35,742
68