Harley Davidson 2014 Annual Report Download - page 101
Download and view the complete annual report
Please find page 101 of the 2014 Harley Davidson annual report below. You can navigate through the pages in the report by either clicking on the pages listed below, or by using the keyword search tool below to find specific information within the annual report.-
 1
1 -
2
-
3
-
4
-
5
-
6
-
7
-
8
-
9
-
10
-
11
-
12
-
13
-
14
-
15
-
16
-
17
-
18
-
19
-
20
-
21
-
22
-
23
-
24
-
25
-
26
-
27
-
28
-
29
-
30
-
31
-
32
-
33
-
34
-
35
-
36
-
37
-
38
-
39
-
40
-
41
-
42
-
43
-
44
-
45
-
46
-
47
-
48
-
49
-
50
-
51
-
52
-
53
-
54
-
55
-
56
-
57
-
58
-
59
-
60
-
61
-
62
-
63
-
64
-
65
-
66
-
67
-
68
-
69
-
70
-
71
-
72
-
73
-
74
-
75
-
76
-
77
-
78
-
79
-
80
-
81
-
82
-
83
-
84
-
85
-
86
-
87
-
88
-
89
-
90
-
 91
91 -
 92
92 -
 93
93 -
 94
94 -
 95
95 -
 96
96 -
 97
97 -
 98
98 -
 99
99 -
 100
100 -
 101
101 -
 102
102 -
 103
103 -
 104
104 -
 105
105 -
 106
106 -
 107
107 -
 108
108 -
 109
109 -
 110
110 -
 111
111 -
112
-
113
-
114
-
115
-
116
-
117
 |
 |

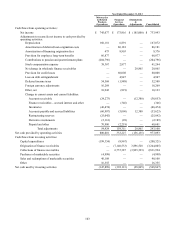
Year Ended December 31, 2014
Motorcycles
& Related
Products
Operations
Financial
Services
Operations
Eliminations
&
Adjustments Consolidated
Cash flows from operating activities:
Net income $795,530 $169,081 $(120,000) $ 844,611
Adjustments to reconcile net income to cash provided by
operating activities:
Depreciation 171,187 8,113 — 179,300
Amortization of deferred loan origination costs — 94,429 — 94,429
Amortization of financing origination fees 59 8,383 — 8,442
Provision for employee long-term benefits 33,709 — — 33,709
Contributions to pension and postretirement plans (29,686)— — (29,686)
Stock compensation expense 35,064 2,865 — 37,929
Net change in wholesale finance receivables — — (75,210)(75,210)
Provision for credit losses — 80,946 — 80,946
Loss on debt extinguishment — 3,942 — 3,942
Deferred income taxes (191)(7,430)— (7,621)
Foreign currency adjustments 21,964 — — 21,964
Other, net 20,273 (21,764)— (1,491)
Change in current assets and current liabilities:
Accounts receivable (31,740)— 21,931 (9,809)
Finance receivables—accrued interest and other — (2,515)— (2,515)
Inventories (50,886)— — (50,886)
Accounts payable and accrued liabilities 16,074 21,629 (18,575)19,128
Restructuring reserves 2,181 — — 2,181
Derivative instruments 703 — — 703
Prepaid and other (17,187)13,798 — (3,389)
Total adjustments 171,524 202,396 (71,854)302,066
Net cash provided by operating activities 967,054 371,477 (191,854)1,146,677
Cash flows from investing activities:
Capital expenditures (224,262)(8,057)— (232,319)
Origination of finance receivables — (7,693,884)4,125,461 (3,568,423)
Collections of finance receivables — 7,066,852 (4,053,607)3,013,245
Sales and redemptions of marketable securities 41,010 — — 41,010
Other 1,837 — — 1,837
Net cash used by investing activities (181,415)(635,089)71,854 (744,650)
101