Harley Davidson 2014 Annual Report Download - page 29
Download and view the complete annual report
Please find page 29 of the 2014 Harley Davidson annual report below. You can navigate through the pages in the report by either clicking on the pages listed below, or by using the keyword search tool below to find specific information within the annual report.-
 1
1 -
2
-
3
-
4
-
5
-
6
-
7
-
8
-
9
-
10
-
11
-
12
-
13
-
14
-
15
-
16
-
17
-
18
-
 19
19 -
 20
20 -
 21
21 -
 22
22 -
 23
23 -
 24
24 -
 25
25 -
 26
26 -
 27
27 -
 28
28 -
 29
29 -
 30
30 -
 31
31 -
 32
32 -
 33
33 -
 34
34 -
 35
35 -
 36
36 -
 37
37 -
 38
38 -
 39
39 -
40
-
41
-
42
-
43
-
44
-
45
-
46
-
47
-
48
-
49
-
50
-
51
-
52
-
53
-
54
-
55
-
56
-
57
-
58
-
59
-
60
-
61
-
62
-
63
-
64
-
65
-
66
-
67
-
68
-
69
-
70
-
71
-
72
-
73
-
74
-
75
-
76
-
77
-
78
-
79
-
80
-
81
-
82
-
83
-
84
-
85
-
86
-
87
-
88
-
89
-
90
-
91
-
92
-
93
-
94
-
95
-
96
-
97
-
98
-
99
-
100
-
101
-
102
-
103
-
104
-
105
-
106
-
107
-
108
-
109
-
110
-
111
-
112
-
113
-
114
-
115
-
116
-
117
 |
 |

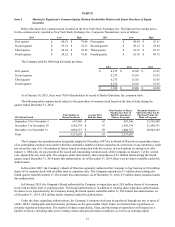
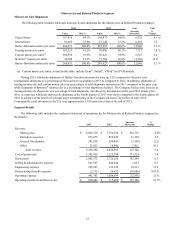
The following table includes the estimated impact of the significant factors affecting the comparability of net revenue,
cost of goods sold and gross profit from 2013 to 2014 (in millions):
Net
Revenue
Cost of
Goods
Sold
Gross
Profit
2013 $5,259 $3,397 $1,862
Volume 124 85 39
Price 166 119 47
Foreign currency exchange rates and hedging (31)(19)(12)
Shipment mix 50 (16)66
Raw material prices — 1 (1)
Manufacturing costs — (24)24
Total 309 146 163
2014 $5,568 $3,543 $2,025
The following factors affected the comparability of net revenue, cost of goods sold and gross profit from 2013 to 2014:
• Volume increases were driven by the increase in wholesale motorcycle shipments and parts and accessories sales,
partially offset by lower sales volumes for general merchandise. General merchandise revenue was adversely impacted
in 2014 by a SKU reduction plan across the apparel offering focused on transforming the retail customer experience
with a more targeted assortment of popular styles.
• On average, wholesale prices on the Company’s 2014 and 2015 model-year motorcycles are higher than the preceding
model-year resulting in the favorable impact on revenue during the period. The revenue favorability resulting from
model-year price increases was partially offset by an increase in cost related to the significant additional content added
to the 2014 and 2015 model-year motorcycles.
• Net revenue and gross profit were negatively impacted by a devaluation in the Company's key foreign currencies
compared to the U.S. dollar, primarily the Euro, Japanese yen, Brazilian real and Australian dollar, which together
declined approximately 3% on a weighted-average basis in 2014 compared to 2013.
• Shipment mix changes between motorcycle families positively impacted net revenue and gross profit as a result of a
higher mix of Touring motorcycles which was partially offset by an increase in Street motorcycle shipments. Shipment
mix also benefited from favorable model mix within motorcycle families, as well as, favorable mix within the parts
and accessories and general merchandise product lines. For the first quarter of 2015, the Company expects mix to
adversely impact margin driven by an expected increase in Street motorcycle shipments(1).
• Raw material prices were slightly higher in 2014 relative to 2013.
• Manufacturing costs for 2014 benefited from increased year-over-year production, restructuring savings, lower
temporary inefficiencies and lower pension costs compared to 2013. The manufacturing cost benefits were partially
offset by start-up costs of approximately $15.3 million associated with the launch of the Street platform of
motorcycles.
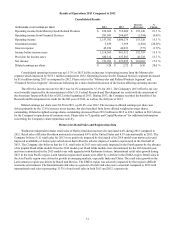
The net increase in operating expense was primarily due to higher selling and administrative expenses and the absence of
the restructuring benefit recorded in 2013, partially offset by lower engineering expense. The higher selling and administrative
expenses were primarily due to higher spending in support of the Company's growth initiatives and higher recall costs. In 2013,
the Company completed work related to its various restructuring activities that were initiated during 2009 through 2011. For
further information regarding the Company’s previously announced restructuring activities, refer to Note 3 of Notes to
Condensed Consolidated Financial Statements.
29