Harley Davidson 2014 Annual Report Download - page 35
Download and view the complete annual report
Please find page 35 of the 2014 Harley Davidson annual report below. You can navigate through the pages in the report by either clicking on the pages listed below, or by using the keyword search tool below to find specific information within the annual report.-
 1
1 -
2
-
3
-
4
-
5
-
6
-
7
-
8
-
9
-
10
-
11
-
12
-
13
-
14
-
15
-
16
-
17
-
18
-
19
-
20
-
21
-
22
-
23
-
24
-
 25
25 -
 26
26 -
 27
27 -
 28
28 -
 29
29 -
 30
30 -
 31
31 -
 32
32 -
 33
33 -
 34
34 -
 35
35 -
 36
36 -
 37
37 -
 38
38 -
 39
39 -
 40
40 -
 41
41 -
 42
42 -
 43
43 -
 44
44 -
 45
45 -
46
-
47
-
48
-
49
-
50
-
51
-
52
-
53
-
54
-
55
-
56
-
57
-
58
-
59
-
60
-
61
-
62
-
63
-
64
-
65
-
66
-
67
-
68
-
69
-
70
-
71
-
72
-
73
-
74
-
75
-
76
-
77
-
78
-
79
-
80
-
81
-
82
-
83
-
84
-
85
-
86
-
87
-
88
-
89
-
90
-
91
-
92
-
93
-
94
-
95
-
96
-
97
-
98
-
99
-
100
-
101
-
102
-
103
-
104
-
105
-
106
-
107
-
108
-
109
-
110
-
111
-
112
-
113
-
114
-
115
-
116
-
117
 |
 |

Financial Services Segment
Segment Results
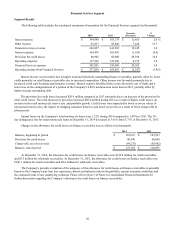
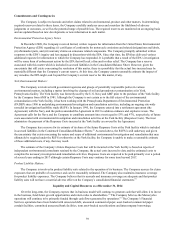
The following table includes the condensed statements of operations for the Financial Services segment (in thousands):€
2013 2012
(Decrease)
Increase
%
Change
Interest income $583,174 $583,700 $(526)(0.1)%
Other income 58,408 54,224 4,184 7.7
Financial services revenue 641,582 637,924 3,658 0.6
Interest expense 165,491 195,990 (30,499)(15.6)
Provision for credit losses 60,008 22,239 37,769 169.8
Operating expenses 132,990 135,008 (2,018)(1.5)
Financial Services expense 358,489 353,237 5,252 1.5
Operating income from Financial Services $283,093 $284,687 $(1,594)(0.6)%
Other income was favorable primarily due to higher fee income, increased credit card licensing revenue and increased
insurance revenue. Interest expense benefited from a more favorable cost of funds, partially offset by higher debt levels related
to higher average finance receivables outstanding.
The provision for credit losses was unfavorable compared to 2012 due to an increase in the provision for retail credit
losses. Retail motorcycle credit losses increased $15.8 million in 2013 as compared to 2012 due to lower year-over-year
recoveries as well as a higher frequency of loss.€As a result, the 2013 retail motorcycle provision increased $36.8 million.
Additionally, 2012 benefited from approximately $17.0 million in allowance releases.
Annual losses on the Company's retail motorcycle loans were 1.09% during 2013 compared to 0.79% in 2012. The 30-
day delinquency rate for retail motorcycle loans at December€31, 2013 decreased to 3.71% from 3.94% at December€31, 2012.
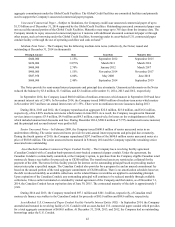
Changes in the allowance for credit losses on finance receivables were as follows (in thousands):€
2013 2012
Balance, beginning of period $107,667 $125,449
Provision for credit losses 60,008 22,239
Charge-offs, net of recoveries (56,982)(40,021)
Balance, end of period $110,693 $107,667
At December€31, 2013, the allowance for credit losses on finance receivables was $106.1 million for retail receivables
and $4.6 million for wholesale receivables. At December€31, 2012, the allowance for credit losses on finance receivables was
$101.4 million for retail receivables and $6.2 million for wholesale receivables.
The Company's periodic evaluation of the adequacy of the allowance for credit losses on finance receivables is generally
based on the Company's past loan loss experience, known and inherent risks in the portfolio, current economic conditions and
the estimated value of any underlying collateral. Please refer to Note 5 of Notes to Consolidated Financial Statements for
further discussion regarding the Company’s allowance for credit losses on finance receivables.
35