Harley Davidson 2014 Annual Report Download - page 23
Download and view the complete annual report
Please find page 23 of the 2014 Harley Davidson annual report below. You can navigate through the pages in the report by either clicking on the pages listed below, or by using the keyword search tool below to find specific information within the annual report.-
 1
1 -
2
-
3
-
4
-
5
-
6
-
7
-
8
-
9
-
10
-
11
-
12
-
 13
13 -
 14
14 -
 15
15 -
 16
16 -
 17
17 -
 18
18 -
 19
19 -
 20
20 -
 21
21 -
 22
22 -
 23
23 -
 24
24 -
 25
25 -
 26
26 -
 27
27 -
 28
28 -
 29
29 -
 30
30 -
 31
31 -
 32
32 -
 33
33 -
34
-
35
-
36
-
37
-
38
-
39
-
40
-
41
-
42
-
43
-
44
-
45
-
46
-
47
-
48
-
49
-
50
-
51
-
52
-
53
-
54
-
55
-
56
-
57
-
58
-
59
-
60
-
61
-
62
-
63
-
64
-
65
-
66
-
67
-
68
-
69
-
70
-
71
-
72
-
73
-
74
-
75
-
76
-
77
-
78
-
79
-
80
-
81
-
82
-
83
-
84
-
85
-
86
-
87
-
88
-
89
-
90
-
91
-
92
-
93
-
94
-
95
-
96
-
97
-
98
-
99
-
100
-
101
-
102
-
103
-
104
-
105
-
106
-
107
-
108
-
109
-
110
-
111
-
112
-
113
-
114
-
115
-
116
-
117
 |
 |

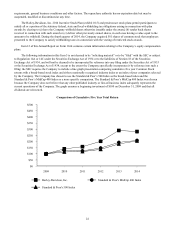
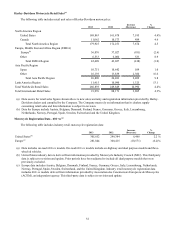
2009
($)
2010
($)
2011
($)
2012
($)
2013
($)
2014
($)
Harley-Davidson, Inc. 100 140 158 202 290 281
Standard€& Poor’s MidCap 400 Index 100 127 124 147 193 209
Standard€& Poor’s 500 Index 100 115 118 136 180 205
23
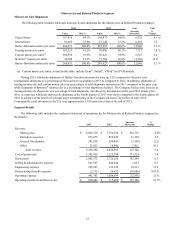
€Item 6. Selected Financial Data
(In thousands, except per share amounts) 2014 2013 2012 2011 2010(1)
Statement of income data:
Revenue:
Motorcycles€& Related Products $5,567,681 $5,258,290 $4,942,582 $4,662,264 $4,176,627
Financial Services 660,827 641,582 637,924 649,449 682,709
Total revenue $6,228,508 $5,899,872 $5,580,506 $5,311,713 $4,859,336
Income from continuing
operations
$844,611 $733,993 $623,925 $548,078 $259,669
Income (loss) from discontinued
operations, net of tax
— — — 51,036 (113,124)
Net income $844,611 $733,993 $623,925 $599,114 $146,545
Weighted-average common shares:
Basic 216,305 222,475 227,119 232,889 233,312
Diluted 217,706 224,071 229,229 234,918 234,787
Earnings per common share from
continuing operations:
Basic $3.90 $3.30 $2.75 $2.35 $1.11
Diluted $3.88 $3.28 $2.72 $2.33 $1.11
Earnings (loss) per common share
from discontinued operations:
Basic $—$—$—$0.22 $(0.48)
Diluted $—$—$—$0.22 $(0.48)
Earnings per common share:
Basic $3.90 $3.30 $2.75 $2.57 $0.63
Diluted $3.88 $3.28 $2.72 $2.55 $0.62
Dividends paid per common share $1.100 $0.840 $0.620 $0.475 $0.400
Balance sheet data:
Total assets $9,528,097 $9,405,040 $9,170,773 $9,674,164 $9,430,740
Total debt $5,504,629 $5,259,170 $5,102,649 $5,722,619 $5,752,356
Total equity $2,909,286 $3,009,486 $2,557,624 $2,420,256 $2,206,866
€
(1) The Company began consolidating formerly off-balance sheet qualifying special purpose entities as required by the new
guidance within Accounting Standards Codification (ASC) Topic 810, “Consolidations” and ASC Topic 860, “Transfers
and Servicing” in 2010.