Harley Davidson 2014 Annual Report Download - page 31
Download and view the complete annual report
Please find page 31 of the 2014 Harley Davidson annual report below. You can navigate through the pages in the report by either clicking on the pages listed below, or by using the keyword search tool below to find specific information within the annual report.-
 1
1 -
2
-
3
-
4
-
5
-
6
-
7
-
8
-
9
-
10
-
11
-
12
-
13
-
14
-
15
-
16
-
17
-
18
-
19
-
20
-
 21
21 -
 22
22 -
 23
23 -
 24
24 -
 25
25 -
 26
26 -
 27
27 -
 28
28 -
 29
29 -
 30
30 -
 31
31 -
 32
32 -
 33
33 -
 34
34 -
 35
35 -
 36
36 -
 37
37 -
 38
38 -
 39
39 -
 40
40 -
 41
41 -
42
-
43
-
44
-
45
-
46
-
47
-
48
-
49
-
50
-
51
-
52
-
53
-
54
-
55
-
56
-
57
-
58
-
59
-
60
-
61
-
62
-
63
-
64
-
65
-
66
-
67
-
68
-
69
-
70
-
71
-
72
-
73
-
74
-
75
-
76
-
77
-
78
-
79
-
80
-
81
-
82
-
83
-
84
-
85
-
86
-
87
-
88
-
89
-
90
-
91
-
92
-
93
-
94
-
95
-
96
-
97
-
98
-
99
-
100
-
101
-
102
-
103
-
104
-
105
-
106
-
107
-
108
-
109
-
110
-
111
-
112
-
113
-
114
-
115
-
116
-
117
 |
 |

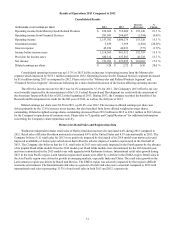
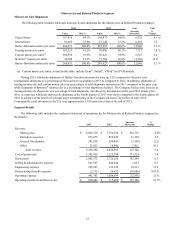
Results of Operations 2013 Compared to 2012
Consolidated Results€
(in thousands, except earnings per share) 2013 2012
Increase
(Decrease)
%
Change
Operating income from Motorcycles€& Related Products $870,609 $715,489 $155,120 21.7 %
Operating income from Financial Services 283,093 284,687 (1,594)(0.6)%
Operating income 1,153,702 1,000,176 153,526 15.3 %
Investment income 5,859 7,369 (1,510)(20.5)%
Interest expense 45,256 46,033 (777)(1.7)%
Income before income taxes 1,114,305 961,512 152,793 15.9 %
Provision for income taxes 380,312 337,587 42,725 12.7 %
Net income $733,993 $623,925 $110,068 17.6 %
Diluted earnings per share $3.28 $2.72 $0.56 20.6 %
Consolidated operating income was up 15.3% in 2013 led by an increase in operating income from the Motorcycles
segment which improved by $155.1 million compared to 2012. Operating income for the Financial Services segment decreased
by $1.6 million during 2013 as compared to 2012. Please refer to the “Motorcycles and Related Products Segment” and
“Financial Services Segment” discussions following for a more detailed discussion of the factors affecting operating income.
The effective income tax rate for 2013 was 34.1% compared to 35.1% for 2012. The Company's 2013 effective tax rate
was favorably impacted by the reinstatement of the U.S. Federal Research and Development tax credit with the enactment of
the American Taxpayer Relief Act of 2012 at the beginning of 2013. During 2013, the Company recorded the benefits of the
Research and Development tax credit for the full year of 2012, as well as, the full year of 2013.
Diluted earnings per share were $3.28 in 2013, up 20.6% over 2012. The increase in diluted earnings per share was
driven primarily by the 17.6% increase in net income, but also benefited from lower diluted weighted average shares
outstanding. Diluted weighted average shares outstanding decreased from 229.2 million in 2012 to 224.1 million in 2013 driven
by the Company's repurchases of common stock. Please refer to "Liquidity and Capital Resources" for additional information
concerning the Company's share repurchase activity.
31
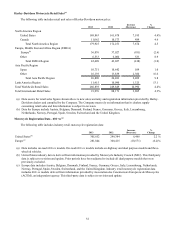
Motorcycles Retail Sales and Registration Data
Worldwide independent dealer retail sales of Harley-Davidson motorcycles increased 4.4% during 2013 compared to
2012. Retail sales of Harley-Davidson motorcycles increased 4.4% in the United States and 4.3% internationally in 2013. The
Company believes U.S. retail sales for 2013 were positively impacted by the launch of its 2014 model-year motorcycles and
improved availability of motorcycles which more than offset the adverse impact of weather experienced in the first half of
2013. The Company also believes that the U.S. retail sales in 2013 were adversely impacted in the fourth quarter by the absence
of its popular Road Glide models from the 2014 model-year. Road Glide models were discontinued for the 2014 model-year,
and were reintroduced in the 2015 model-year with upgraded with Rushmore features. International retail sales growth during
2013 in the Asia Pacific region, Latin America region and Canada were offset by a decline in the EMEA region. Retail sales in
the Asia Pacific region were driven by growth in emerging markets, especially India and China. The retail sales growth in the
Latin America region was driven by Brazil and Mexico. The EMEA region was adversely impacted by that region's difficult
economic environment. The International retail sales as a percent of total retail sales were consistent compared to 2012 with
international retail sales representing 35.3% of total retail sales in both 2013 and 2012, respectively.