Harley Davidson 2014 Annual Report Download - page 75
Download and view the complete annual report
Please find page 75 of the 2014 Harley Davidson annual report below. You can navigate through the pages in the report by either clicking on the pages listed below, or by using the keyword search tool below to find specific information within the annual report.-
 1
1 -
2
-
3
-
4
-
5
-
6
-
7
-
8
-
9
-
10
-
11
-
12
-
13
-
14
-
15
-
16
-
17
-
18
-
19
-
20
-
21
-
22
-
23
-
24
-
25
-
26
-
27
-
28
-
29
-
30
-
31
-
32
-
33
-
34
-
35
-
36
-
37
-
38
-
39
-
40
-
41
-
42
-
43
-
44
-
45
-
46
-
47
-
48
-
49
-
50
-
51
-
52
-
53
-
54
-
55
-
56
-
57
-
58
-
59
-
60
-
61
-
62
-
63
-
64
-
 65
65 -
 66
66 -
 67
67 -
 68
68 -
 69
69 -
 70
70 -
 71
71 -
 72
72 -
 73
73 -
 74
74 -
 75
75 -
 76
76 -
 77
77 -
 78
78 -
 79
79 -
 80
80 -
 81
81 -
 82
82 -
 83
83 -
 84
84 -
 85
85 -
86
-
87
-
88
-
89
-
90
-
91
-
92
-
93
-
94
-
95
-
96
-
97
-
98
-
99
-
100
-
101
-
102
-
103
-
104
-
105
-
106
-
107
-
108
-
109
-
110
-
111
-
112
-
113
-
114
-
115
-
116
-
117
 |
 |

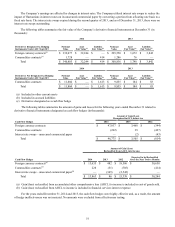
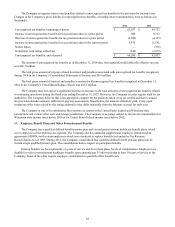
The Company’s earnings are affected by changes in interest rates. The Company utilized interest rate swaps to reduce the
impact of fluctuations in interest rates on its unsecured commercial paper by converting a portion from a floating rate basis to a
fixed rate basis. The interest rate swaps expired during the second quarter of 2013, and as of December 31, 2013, there were no
interest rate swaps outstanding.
The following tables summarize the fair value of the Company’s derivative financial instruments at December€31 (in
thousands):
2014 2013
Derivatives Designated As Hedging
Instruments Under ASC Topic 815
Notional
Value
Asset
Fair€Value(a) Liability
Fair€Value(b) Notional
Value
Asset
Fair€Value(a) Liability
Fair€Value(b)
Foreign currency contracts(c) $339,077 $32,244 $—$299,550 $1,672 $3,842
Commodities contracts(c) 1,728 — 414 1,286 76 —
Total $340,805 $32,244 $414 $300,836 $1,748 $3,842
2014 2013
Derivatives Not Designated As Hedging
Instruments Under ASC Topic 815
Notional
Value
Asset
Fair Value(a) Liability
Fair Value(b) Notional
Value
Asset
Fair Value(a) Liability
Fair Value(b)
Commodities contracts $11,804 $—$1,613 $9,855 $184 $83
Total $11,804 $—$1,613 $9,855 $184 $83 €
(a) Included in other current assets
(b) Included in accrued liabilities
(c) Derivative designated as a cash flow hedge
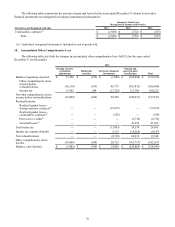
The following tables summarize the amount of gains and losses for the following years ended December€31 related to
derivative financial instruments designated as cash flow hedges (in thousands):€
Amount of Gain/(Loss)
Recognized in OCI, before tax
Cash Flow Hedges 2014 2013 2012
Foreign currency contracts $47,037 $3,468 $(344)
Commodities contracts (262)39 (427)
Interest rate swaps – unsecured commercial paper — (2)(43)
Total $46,775 $3,505 $(814)
Amount of Gain/(Loss)
Reclassified from AOCL into Income
Cash Flow Hedges 2014 2013 2012
Expected€to€be€Reclassified
Over€the€Next€Twelve€Months
Foreign currency contracts(a) $13,635 $482 $18,586 $30,658
Commodities contracts(a) 228 (51)(705)(414)
Interest rate swaps – unsecured commercial paper(b) — (345)(2,542)—
Total $13,863 $86 $15,339 $30,244
€
(a) Gain/(loss) reclassified from accumulated other comprehensive loss (AOCL) to income is included in cost of goods sold.
(b) Gain/(loss) reclassified from AOCL to income is included in financial services interest expense.
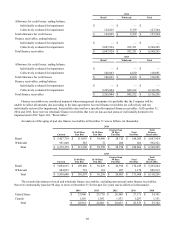
For the years ended December€31, 2014 and 2013, the cash flow hedges were highly effective and, as a result, the amount
of hedge ineffectiveness was not material. No amounts were excluded from effectiveness testing.
75