Harley Davidson 2014 Annual Report Download - page 95
Download and view the complete annual report
Please find page 95 of the 2014 Harley Davidson annual report below. You can navigate through the pages in the report by either clicking on the pages listed below, or by using the keyword search tool below to find specific information within the annual report.-
 1
1 -
2
-
3
-
4
-
5
-
6
-
7
-
8
-
9
-
10
-
11
-
12
-
13
-
14
-
15
-
16
-
17
-
18
-
19
-
20
-
21
-
22
-
23
-
24
-
25
-
26
-
27
-
28
-
29
-
30
-
31
-
32
-
33
-
34
-
35
-
36
-
37
-
38
-
39
-
40
-
41
-
42
-
43
-
44
-
45
-
46
-
47
-
48
-
49
-
50
-
51
-
52
-
53
-
54
-
55
-
56
-
57
-
58
-
59
-
60
-
61
-
62
-
63
-
64
-
65
-
66
-
67
-
68
-
69
-
70
-
71
-
72
-
73
-
74
-
75
-
76
-
77
-
78
-
79
-
80
-
81
-
82
-
83
-
84
-
 85
85 -
 86
86 -
 87
87 -
 88
88 -
 89
89 -
 90
90 -
 91
91 -
 92
92 -
 93
93 -
 94
94 -
 95
95 -
 96
96 -
 97
97 -
 98
98 -
 99
99 -
 100
100 -
 101
101 -
 102
102 -
 103
103 -
 104
104 -
 105
105 -
106
-
107
-
108
-
109
-
110
-
111
-
112
-
113
-
114
-
115
-
116
-
117
 |
 |

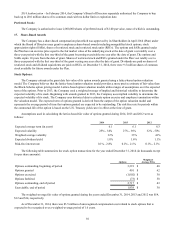
Options to purchase 0.5 million, 0.9 million and 2.1 million weighted-average shares of common stock outstanding
during 2014, 2013 and 2012, respectively, were not included in the Company’s computation of dilutive securities because the
exercise price was greater than the market price and therefore the effect would have been anti-dilutive.
The Company has a share-based compensation plan under which employees may be granted share-based awards
including shares of restricted stock and restricted stock units (RSUs). Non-forfeitable dividends are paid on unvested shares of
restricted stock and non-forfeitable dividend equivalents are paid on unvested RSUs. As such, shares of restricted stock and
RSUs are considered participating securities under the two-class method of calculating earnings per share as described in ASC
Topic 260, “Earnings per Share.” The two-class method of calculating earnings per share did not have a material impact on the
Company’s earnings per share calculation as of December€31, 2014, 2013 and 2012.
95
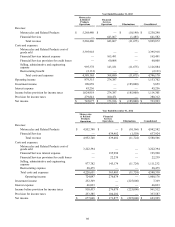
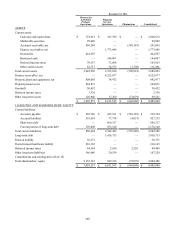
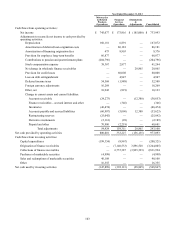
19.€€€€Reportable Segments and Geographic Information
Reportable Segments:
Harley-Davidson, Inc. is the parent company for the groups of companies doing business as Harley-Davidson Motor
Company (HDMC) and Harley-Davidson Financial Services (HDFS). The Company operates in two segments: the
Motorcycles€& Related Products (Motorcycles) segment and the Financial Services segment. The Company’s reportable
segments are strategic business units that offer different products and services and are managed separately based on the
fundamental differences in their operations.
The Motorcycle reportable segment consists of HDMC which designs, manufactures and sells at wholesale street-legal
Harley-Davidson motorcycles as well as a line of motorcycle parts, accessories, general merchandise and related services. The
Company's products are sold to retail customers through a network of independent dealers. The Company conducts business on
a global basis, with sales in North America, Europe/Middle East/Africa (EMEA), Asia-Pacific and Latin America.
The Financial Services reportable segment consists of HDFS which provides wholesale and retail financing and provides
insurance and insurance-related programs primarily to Harley-Davidson dealers and their retail customers. HDFS conducts
business principally in the United States and Canada.
Information by segment is set forth below for the years ended December€31 (in thousands):€
2014 2013 2012
Motorcycles net revenue $5,567,681 $5,258,290 $4,942,582
Gross profit 2,025,080 1,862,372 1,720,188
Selling, administrative and engineering expense 1,021,933 993,894 976,224
Restructuring (benefit) expense and other impairments — (2,131)28,475
Operating income from Motorcycles $1,003,147 $870,609 $715,489
Financial Services revenue $660,827 $641,582 $637,924
Financial Services expense 382,991 358,489 353,237
Operating income from Financial Services $277,836 $283,093 $284,687
Financial Services revenue includes $8.1 million, $10.4 million and $11.5 million of interest that HDMC paid to HDFS
on wholesale finance receivables in 2014, 2013 and 2012, respectively. The offsetting cost of these interest incentives was
recorded as a reduction to Motorcycles revenue.