Harley Davidson 2014 Annual Report Download - page 41
Download and view the complete annual report
Please find page 41 of the 2014 Harley Davidson annual report below. You can navigate through the pages in the report by either clicking on the pages listed below, or by using the keyword search tool below to find specific information within the annual report.-
 1
1 -
2
-
3
-
4
-
5
-
6
-
7
-
8
-
9
-
10
-
11
-
12
-
13
-
14
-
15
-
16
-
17
-
18
-
19
-
20
-
21
-
22
-
23
-
24
-
25
-
26
-
27
-
28
-
29
-
30
-
 31
31 -
 32
32 -
 33
33 -
 34
34 -
 35
35 -
 36
36 -
 37
37 -
 38
38 -
 39
39 -
 40
40 -
 41
41 -
 42
42 -
 43
43 -
 44
44 -
 45
45 -
 46
46 -
 47
47 -
 48
48 -
 49
49 -
 50
50 -
 51
51 -
52
-
53
-
54
-
55
-
56
-
57
-
58
-
59
-
60
-
61
-
62
-
63
-
64
-
65
-
66
-
67
-
68
-
69
-
70
-
71
-
72
-
73
-
74
-
75
-
76
-
77
-
78
-
79
-
80
-
81
-
82
-
83
-
84
-
85
-
86
-
87
-
88
-
89
-
90
-
91
-
92
-
93
-
94
-
95
-
96
-
97
-
98
-
99
-
100
-
101
-
102
-
103
-
104
-
105
-
106
-
107
-
108
-
109
-
110
-
111
-
112
-
113
-
114
-
115
-
116
-
117
 |
 |

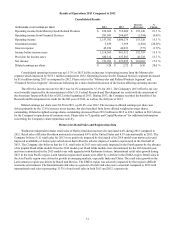
Investing Activities
The Company’s investing activities consist primarily of capital expenditures, net changes in retail finance receivables and
short-term investment activity. Capital expenditures were $232.3 million, $208.3 million and $189.0 million during 2014, 2013
and 2012, respectively.
Net cash flows from finance receivables for 2014, which consisted primarily of retail finance receivables, were $143.2
million lower than 2013 as a result of an increase in retail motorcycle loan originations during 2014. Net cash flows from
finance receivables for 2013, which consisted primarily of retail finance receivables, were $321.4 million lower than in 2012 as
a result of an increase in retail motorcycle loan originations during 2013.
Changes in the Company’s investment in marketable securities resulted in cash inflows of $41.0 million, $35.1 million
and $18.3 million in 2014, 2013 and 2012, respectively,
41
Financing Activities
The Company’s financing activities consist primarily of dividend payments, share repurchases and debt activity.
The Company paid dividends of $1.10 per share totaling $238.3 million during 2014, $0.84 per share totaling $187.7
million during 2013 and $0.62 per share totaling $141.7 million in 2012.
Cash outflows from share repurchases were $615.6 million, $479.2 million and $311.6 million for 2014, 2013 and 2012,
respectively. Share repurchases during 2014, 2013 and 2012 included 9.3 million, 8.2 million and 6.7 million shares of common
stock, respectively, related to discretionary share repurchases and shares of common stock that employees surrendered to satisfy
withholding taxes in connection with the vesting of restricted stock awards. On February 5, 2014, the Company announced that
the Company's Board of Directors had authorized the Company to repurchase up to 20 million shares of its common stock. In
total at December€31, 2014, the Company had board approved authorizations to repurchase 20.9 million shares of its common
stock.
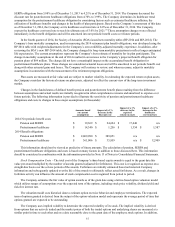
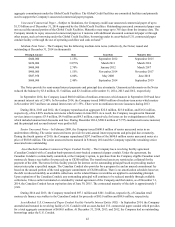
The Company’s total outstanding debt consisted of the following as of December€31, 2014, 2013 and 2012 (in
thousands):€
2014 2013 2012
Unsecured commercial paper $731,786 $666,317 $294,943
Asset-backed Canadian commercial paper conduit facility 166,912 174,241 175,658
Medium-term notes 3,334,398 2,858,980 2,881,272
Senior unsecured notes — 303,000 303,000
Term asset-backed securitization debt 1,271,533 1,256,632 1,447,776
Total debt $5,504,629 $5,259,170 $5,102,649
To access the debt capital markets, the Company relies on credit rating agencies to assign short-term and long-term credit
ratings. Generally, lower credit ratings result in higher borrowing costs and reduced access to debt capital markets. A credit
rating agency may change or withdraw the Company’s ratings based on its assessment of the Company’s current and future
ability to meet interest and principal repayment obligations. The Company’s short-term debt ratings affect its ability to issue
unsecured commercial paper. The Company’s short- and long-term debt ratings as of December€31, 2014 were as follows:€
Short-Term Long-Term Outlook
Moody’s P2 A3 Stable
Standard & Poor’s A2 A- Stable
Fitch(a) F1 A Stable
Global Credit Facilities – On April 7, 2014, the Company entered into a new $675.0 million five-year credit facility to
refinance and replace a $675.0 million four-year credit facility that was due to mature in April 2015. The new five-year credit
facility matures in April 2019. The Company also has a $675.0 million five-year credit facility which matures in April 2017.
The new five-year credit facility and the existing five-year credit facility (together, the Global Credit Facilities) bear interest at
various variable interest rates, which may be adjusted upward or downward depending on certain criteria, such as credit ratings.
The Global Credit Facilities also require the Company to pay a fee based upon the average daily unused portion of the