Harley Davidson 2014 Annual Report Download - page 83
Download and view the complete annual report
Please find page 83 of the 2014 Harley Davidson annual report below. You can navigate through the pages in the report by either clicking on the pages listed below, or by using the keyword search tool below to find specific information within the annual report.-
 1
1 -
2
-
3
-
4
-
5
-
6
-
7
-
8
-
9
-
10
-
11
-
12
-
13
-
14
-
15
-
16
-
17
-
18
-
19
-
20
-
21
-
22
-
23
-
24
-
25
-
26
-
27
-
28
-
29
-
30
-
31
-
32
-
33
-
34
-
35
-
36
-
37
-
38
-
39
-
40
-
41
-
42
-
43
-
44
-
45
-
46
-
47
-
48
-
49
-
50
-
51
-
52
-
53
-
54
-
55
-
56
-
57
-
58
-
59
-
60
-
61
-
62
-
63
-
64
-
65
-
66
-
67
-
68
-
69
-
70
-
71
-
72
-
 73
73 -
 74
74 -
 75
75 -
 76
76 -
 77
77 -
 78
78 -
 79
79 -
 80
80 -
 81
81 -
 82
82 -
 83
83 -
 84
84 -
 85
85 -
 86
86 -
 87
87 -
 88
88 -
 89
89 -
 90
90 -
 91
91 -
 92
92 -
 93
93 -
94
-
95
-
96
-
97
-
98
-
99
-
100
-
101
-
102
-
103
-
104
-
105
-
106
-
107
-
108
-
109
-
110
-
111
-
112
-
113
-
114
-
115
-
116
-
117
 |
 |

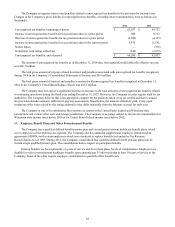
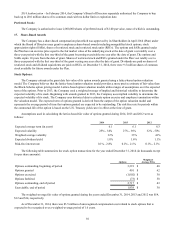
Obligations and Funded Status:
The following table provides the changes in the benefit obligations, fair value of plan assets and funded status of the
Company’s pension, SERPA and postretirement healthcare plans as of the Company’s December€31, 2014 and 2013
measurement dates (in thousands):€
Pension and SERPA Benefits
Postretirement
Healthcare Benefits
2014 2013 2014 2013
Change in benefit obligation:
Benefit obligation, beginning of period $1,714,650 $1,871,575 $366,524 $403,227
Service cost 31,498 35,987 7,015 7,858
Interest cost 86,923 79,248 16,878 15,599
Actuarial (gains) losses 309,542 (199,408)(2,870)(33,729)
Plan participant contributions — — 2,368 2,609
Benefits paid, net of Medicare Part D subsidy (72,633)(72,752)(28,909)(29,040)
Benefit obligation, end of period 2,069,980 1,714,650 361,006 366,524
Change in plan assets:
Fair value of plan assets, beginning of period 1,920,601 1,539,018 147,875 123,106
Actual return on plan assets 143,040 277,388 8,965 24,769
Company contributions 1,638 176,947 28,048 27,849
Plan participant contributions — — 2,368 2,609
Benefits paid (72,633)(72,752)(30,416)(30,458)
Fair value of plan assets, end of period 1,992,646 1,920,601 156,840 147,875
Funded status of the plans, December€31 $(77,334) $ 205,951 $(204,166) $ (218,649)
Amounts recognized in the Consolidated Balance
Sheets, December€31:
Prepaid benefit costs (long-term assets) $—$244,871 $—$—
Accrued benefit liability (current liabilities) (1,148)(2,549)(1,160)(2,484)
Accrued benefit liability (long-term liabilities) (76,186)(36,371)(203,006)(216,165)
Net amount recognized $(77,334) $ 205,951 $(204,166) $ (218,649)
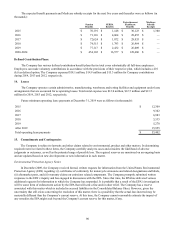
Benefit Costs:
Components of net periodic benefit costs for the years ended December€31 (in thousands):€
Pension and
SERPA Benefits
Postretirement
Healthcare Benefits
2014 2013 2012 2014 2013 2012
Service cost $31,498 $35,987 $33,681 $7,015 $7,858 $7,413
Interest cost 86,923 79,248 83,265 16,878 15,599 18,310
Expected return on plan assets (136,734)(127,327)(117,110)(10,429)(9,537)(9,423)
Amortization of unrecognized:
Prior service cost (credit) 1,119 1,746 2,958 (3,853)(3,853)(3,853)
Net loss 36,563 58,608 43,874 4,729 8,549 7,421
Settlement loss — — 6,242 — — —
Net periodic benefit cost $19,369 $48,262 $52,910 $14,340 $18,616 $19,868
Net periodic benefit costs are allocated among selling, administrative and engineering expense, cost of goods sold and
inventory.
The expected return on plan assets is calculated based on the market-related value of plan assets. The market-related
value of plan assets is different from the fair value in that asset gains/losses are smoothed over a five year period.€
83