HP 2009 Annual Report Download - page 76
Download and view the complete annual report
Please find page 76 of the 2009 HP annual report below. You can navigate through the pages in the report by either clicking on the pages listed below, or by using the keyword search tool below to find specific information within the annual report.-
 1
1 -
2
-
3
-
4
-
5
-
6
-
7
-
8
-
9
-
10
-
11
-
12
-
13
-
14
-
15
-
16
-
17
-
18
-
19
-
20
-
21
-
22
-
23
-
24
-
25
-
26
-
27
-
28
-
29
-
30
-
31
-
32
-
33
-
34
-
35
-
36
-
37
-
38
-
39
-
40
-
41
-
42
-
43
-
44
-
45
-
46
-
47
-
48
-
49
-
50
-
51
-
52
-
53
-
54
-
55
-
56
-
57
-
58
-
59
-
60
-
61
-
62
-
63
-
64
-
65
-
 66
66 -
 67
67 -
 68
68 -
 69
69 -
 70
70 -
 71
71 -
 72
72 -
 73
73 -
 74
74 -
 75
75 -
 76
76 -
 77
77 -
 78
78 -
 79
79 -
 80
80 -
 81
81 -
 82
82 -
 83
83 -
 84
84 -
 85
85 -
 86
86 -
87
-
88
-
89
-
90
-
91
-
92
-
93
-
94
-
95
-
96
-
97
-
98
-
99
-
100
-
101
-
102
-
103
-
104
-
105
-
106
-
107
-
108
-
109
-
110
-
111
-
112
-
113
-
114
-
115
-
116
-
117
-
118
-
119
-
120
-
121
-
122
-
123
-
124
-
125
-
126
-
127
-
128
-
129
-
130
-
131
-
132
-
133
-
134
-
135
-
136
-
137
-
138
-
139
-
140
-
141
-
142
-
143
-
144
-
145
-
146
-
147
-
148
-
149
-
150
-
151
-
152
-
153
-
154
-
155
-
156
-
157
-
158
-
159
-
160
-
161
-
162
-
163
-
164
-
165
-
166
-
167
-
168
-
169
-
170
-
171
-
172
-
173
-
174
-
175
-
176
-
177
-
178
-
179
-
180
-
181
-
182
-
183
-
184
-
185
 |
 |

HEWLETT-PACKARD COMPANY AND SUBSIDIARIES
Management’s Discussion and Analysis of
Financial Condition and Results of Operations (Continued)
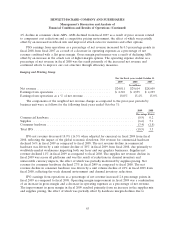
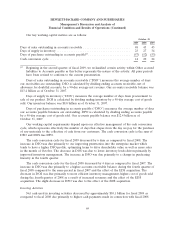
Our key working capital metrics are as follows:
October 31
2009 2008 2007
Days of sales outstanding in accounts receivable ........................... 48 45 43
Days of supply in inventory .......................................... 23 27 34
Days of purchases outstanding in accounts payable(1). ....................... (57) (52) (53)
Cash conversion cycle .............................................. 14 20 24
(1) Beginning in the second quarter of fiscal 2009, we reclassified certain activity within Other accrued
liabilities to Accounts payable as this better represents the nature of the activity. All prior periods
have been revised to conform to the current presentation.
Days of sales outstanding in accounts receivable (‘‘DSO’’) measures the average number of days
our receivables are outstanding. DSO is calculated by dividing ending accounts receivable, net of
allowance for doubtful accounts, by a 90-day average net revenue. Our accounts receivable balance was
$13.4 billion as of October 31, 2007.
Days of supply in inventory (‘‘DOS’’) measures the average number of days from procurement to
sale of our product. DOS is calculated by dividing ending inventory by a 90-day average cost of goods
sold. Our inventory balance was $8.0 billion as of October 31, 2007.
Days of purchases outstanding in accounts payable (‘‘DPO’’) measures the average number of days
our accounts payable balances are outstanding. DPO is calculated by dividing ending accounts payable
by a 90-day average cost of goods sold. Our accounts payable balance was $12.4 billion as of
October 31, 2007.
Our working capital requirements depend upon our effective management of the cash conversion
cycle, which represents effectively the number of days that elapse from the day we pay for the purchase
of raw materials to the collection of cash from our customers. The cash conversion cycle is the sum of
DSO and DOS less DPO.
The cash conversion cycle for fiscal 2009 decreased by 6 days as compared to fiscal 2008. The
increase in DSO was due primarily to our improving penetration into the enterprise market which
tends to have a higher DSO profile, optimizing terms to drive shareholder value as well as more sales
in the month of October. The decrease in DOS was due to lower inventory levels driven primarily by
improved inventory management. The increase in DPO was due primarily to a change in purchasing
linearity in the fourth quarter.
The cash conversion cycle for the fiscal 2008 decreased by 4 days as compared to fiscal 2007. The
increase in DSO was due primarily to a higher accounts receivable balance during the fourth quarter of
fiscal 2008 compared to the same period in fiscal 2007 and the effect of the EDS acquisition. The
decrease in DOS was due primarily to more efficient inventory management, higher cost of goods sold
during the fourth quarter of 2008 as a result of increased revenues and the effect of the EDS
acquisition. The slight decrease in DPO was due to the effect of the EDS acquisition.
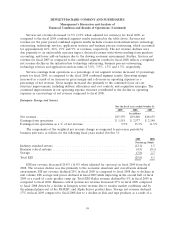
Investing Activities
Net cash used in investing activities decreased by approximately $10.1 billion for fiscal 2009 as
compared to fiscal 2008 due primarily to higher cash payments made in connection with fiscal 2008
69