HP 2009 Annual Report Download - page 168
Download and view the complete annual report
Please find page 168 of the 2009 HP annual report below. You can navigate through the pages in the report by either clicking on the pages listed below, or by using the keyword search tool below to find specific information within the annual report.-
 1
1 -
2
-
3
-
4
-
5
-
6
-
7
-
8
-
9
-
10
-
11
-
12
-
13
-
14
-
15
-
16
-
17
-
18
-
19
-
20
-
21
-
22
-
23
-
24
-
25
-
26
-
27
-
28
-
29
-
30
-
31
-
32
-
33
-
34
-
35
-
36
-
37
-
38
-
39
-
40
-
41
-
42
-
43
-
44
-
45
-
46
-
47
-
48
-
49
-
50
-
51
-
52
-
53
-
54
-
55
-
56
-
57
-
58
-
59
-
60
-
61
-
62
-
63
-
64
-
65
-
66
-
67
-
68
-
69
-
70
-
71
-
72
-
73
-
74
-
75
-
76
-
77
-
78
-
79
-
80
-
81
-
82
-
83
-
84
-
85
-
86
-
87
-
88
-
89
-
90
-
91
-
92
-
93
-
94
-
95
-
96
-
97
-
98
-
99
-
100
-
101
-
102
-
103
-
104
-
105
-
106
-
107
-
108
-
109
-
110
-
111
-
112
-
113
-
114
-
115
-
116
-
117
-
118
-
119
-
120
-
121
-
122
-
123
-
124
-
125
-
126
-
127
-
128
-
129
-
130
-
131
-
132
-
133
-
134
-
135
-
136
-
137
-
138
-
139
-
140
-
141
-
142
-
143
-
144
-
145
-
146
-
147
-
148
-
149
-
150
-
151
-
152
-
153
-
154
-
155
-
156
-
157
-
 158
158 -
 159
159 -
 160
160 -
 161
161 -
 162
162 -
 163
163 -
 164
164 -
 165
165 -
 166
166 -
 167
167 -
 168
168 -
 169
169 -
 170
170 -
 171
171 -
 172
172 -
 173
173 -
 174
174 -
 175
175 -
 176
176 -
 177
177 -
 178
178 -
179
-
180
-
181
-
182
-
183
-
184
-
185
 |
 |

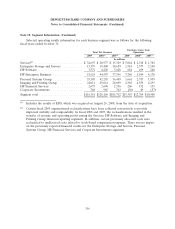
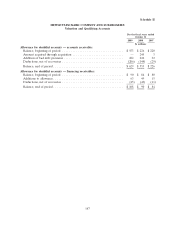
HEWLETT-PACKARD COMPANY AND SUBSIDIARIES
Quarterly Summary
(Unaudited)
(In millions, except per share amounts)
Three-month periods ended
January 31 April 30 July 31 October 31(3)
(Restated) (Restated) (Restated)
2009
Net revenue ................................. $28,807 $27,383 $27,585 $30,777
Cost of sales(1) ............................... 22,073 20,945 21,031 23,475
Research and development ...................... 732 716 667 704
Selling, general and administrative ................. 2,893 2,880 2,874 2,966
Amortization of purchased intangible assets .......... 412 380 379 400
In-process research and development charges ......... 6 — — 1
Restructuring charges .......................... 146 94 362 38
Acquisition-related charges ...................... 48 75 59 60
Total costs and expenses ........................ 26,310 25,090 25,372 27,644
Earnings from operations ....................... 2,497 2,293 2,213 3,133
Interest and other, net ......................... (232) (180) (177) (132)
Earnings before taxes .......................... 2,265 2,113 2,036 3,001
Provision for taxes ............................ 409 392 365 589
Net earnings ................................ $ 1,856 $ 1,721 $ 1,671 $ 2,412
Net earnings per share:(2)
Basic .................................... $ 0.77 $ 0.72 $ 0.70 $ 1.02
Diluted ................................... $ 0.75 $ 0.71 $ 0.69 $ 0.99
Cash dividends paid per share .................... $ 0.08 $ 0.08 $ 0.08 $ 0.08
Range of per share stock prices on the New York Stock
Exchange
Low..................................... $ 28.23 $ 25.39 $ 33.40 $ 42.14
High ..................................... $ 39.53 $ 37.40 $ 43.55 $ 49.20
The amounts previously reported in HP’s Quarterly Reports on Form 10-Q for fiscal 2009 have
been restated for the adoption of ASU 2009-13 and ASU 2009-14, which are discussed more fully in
Note 1. The impact from the adoption was as follows:
Three-month periods ended
January 31 April 30 July 31
Net Revenue ................................ $ 7 $ 32 $134
Cost of sales ................................ 4 26 95
Earnings before taxes ......................... 3 6 39
Net earnings ................................ 2 5 29
Net earnings per share—Diluted ................. $— $0.01 $0.02
161