HP 2009 Annual Report Download - page 68
Download and view the complete annual report
Please find page 68 of the 2009 HP annual report below. You can navigate through the pages in the report by either clicking on the pages listed below, or by using the keyword search tool below to find specific information within the annual report.-
 1
1 -
2
-
3
-
4
-
5
-
6
-
7
-
8
-
9
-
10
-
11
-
12
-
13
-
14
-
15
-
16
-
17
-
18
-
19
-
20
-
21
-
22
-
23
-
24
-
25
-
26
-
27
-
28
-
29
-
30
-
31
-
32
-
33
-
34
-
35
-
36
-
37
-
38
-
39
-
40
-
41
-
42
-
43
-
44
-
45
-
46
-
47
-
48
-
49
-
50
-
51
-
52
-
53
-
54
-
55
-
56
-
57
-
 58
58 -
 59
59 -
 60
60 -
 61
61 -
 62
62 -
 63
63 -
 64
64 -
 65
65 -
 66
66 -
 67
67 -
 68
68 -
 69
69 -
 70
70 -
 71
71 -
 72
72 -
 73
73 -
 74
74 -
 75
75 -
 76
76 -
 77
77 -
 78
78 -
79
-
80
-
81
-
82
-
83
-
84
-
85
-
86
-
87
-
88
-
89
-
90
-
91
-
92
-
93
-
94
-
95
-
96
-
97
-
98
-
99
-
100
-
101
-
102
-
103
-
104
-
105
-
106
-
107
-
108
-
109
-
110
-
111
-
112
-
113
-
114
-
115
-
116
-
117
-
118
-
119
-
120
-
121
-
122
-
123
-
124
-
125
-
126
-
127
-
128
-
129
-
130
-
131
-
132
-
133
-
134
-
135
-
136
-
137
-
138
-
139
-
140
-
141
-
142
-
143
-
144
-
145
-
146
-
147
-
148
-
149
-
150
-
151
-
152
-
153
-
154
-
155
-
156
-
157
-
158
-
159
-
160
-
161
-
162
-
163
-
164
-
165
-
166
-
167
-
168
-
169
-
170
-
171
-
172
-
173
-
174
-
175
-
176
-
177
-
178
-
179
-
180
-
181
-
182
-
183
-
184
-
185
 |
 |

HEWLETT-PACKARD COMPANY AND SUBSIDIARIES
Management’s Discussion and Analysis of
Financial Condition and Results of Operations (Continued)
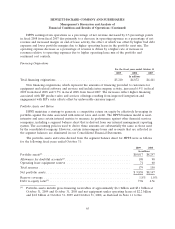
from licenses and services declined, the effect of which was partially offset by increased support
revenue as a result of renewal rate increases. Net revenue from BTO decreased 15% in fiscal 2009 as
compared to fiscal 2008. Net revenue from other software decreased 17% in fiscal 2009 as compared to
fiscal 2008, due to declines in revenues for communication and media solutions, business intelligence
solutions and information management.
HP Software earnings from operations as a percentage of net revenue increased by 7.3 percentage
points in fiscal 2009 as compared to fiscal 2008. The operating margin improvement in fiscal 2009 was
due primarily to increased gross margin coupled with decreased operating expenses as a percentage of
net revenue. The increase in gross margin in fiscal 2009 resulted primarily from a favorable support
and services revenue mix and improved services margins, the effect of which was partially offset by an
unfavorable license revenue mix. The decrease in operating expenses as a percentage of net revenue in
fiscal 2009 was due primarily to continued cost controls.
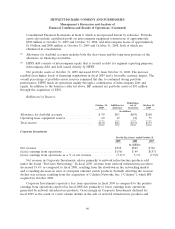
HP Software net revenue increased 16.3% (10.4% when adjusted for currency) in fiscal 2008 from
fiscal 2007. Net revenue from BTO increased 23% in fiscal 2008 as compared to fiscal 2007. BTO net
revenue growth in fiscal 2008 was driven by increases in support, higher license revenue due in part to
the Opsware acquisition, and increases in services contracts. Net revenue from other software increased
by 6% in fiscal 2008 as compared to fiscal 2007. The growth in other software net revenue in fiscal
2008 was attributable primarily to the growth in the information management business due in part to
our acquisition of Tower Software in May 2008 and increases in services from business intelligence
solutions, the effect of which was partially offset by a net revenue decline in communication and media
solutions resulting from a competitive environment following network equipment provider industry
consolidation and the transfer of some hardware revenues to ESS due to a platform shift.
HP Software earnings from operations as a percentage of net revenue increased by 5.0 percentage
points in fiscal 2008 as compared to fiscal 2007. The operating margin increase in fiscal 2008 was the
result of a combination of an increase in gross margin and a decrease in operating expenses as a
percentage of net revenue. The increase in gross margin in fiscal 2008 was due primarily to cost savings
in the BTO business, cost structure improvements as a result of increased scale in the information
management business and, to a lesser extent, a favorable change in the revenue mix driven by higher
revenues from the BTO business, which typically has higher gross margins than the remainder of the
segment. The decrease in operating expenses as a percentage of net revenue in fiscal 2008 was due
primarily to continued cost controls, the effect of which was partially offset by increased field selling
costs driven by sales force investments.
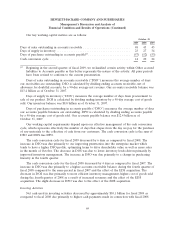
Personal Systems Group
For the fiscal years ended October 31
2009 2008 2007
In millions
Net revenue ........................................... $35,305 $42,295 $36,409
Earnings from operations ................................. $ 1,661 $ 2,375 $ 1,939
Earnings from operations as a % of net revenue ................ 4.7% 5.6% 5.3%
61