HP 2009 Annual Report Download - page 169
Download and view the complete annual report
Please find page 169 of the 2009 HP annual report below. You can navigate through the pages in the report by either clicking on the pages listed below, or by using the keyword search tool below to find specific information within the annual report.-
 1
1 -
2
-
3
-
4
-
5
-
6
-
7
-
8
-
9
-
10
-
11
-
12
-
13
-
14
-
15
-
16
-
17
-
18
-
19
-
20
-
21
-
22
-
23
-
24
-
25
-
26
-
27
-
28
-
29
-
30
-
31
-
32
-
33
-
34
-
35
-
36
-
37
-
38
-
39
-
40
-
41
-
42
-
43
-
44
-
45
-
46
-
47
-
48
-
49
-
50
-
51
-
52
-
53
-
54
-
55
-
56
-
57
-
58
-
59
-
60
-
61
-
62
-
63
-
64
-
65
-
66
-
67
-
68
-
69
-
70
-
71
-
72
-
73
-
74
-
75
-
76
-
77
-
78
-
79
-
80
-
81
-
82
-
83
-
84
-
85
-
86
-
87
-
88
-
89
-
90
-
91
-
92
-
93
-
94
-
95
-
96
-
97
-
98
-
99
-
100
-
101
-
102
-
103
-
104
-
105
-
106
-
107
-
108
-
109
-
110
-
111
-
112
-
113
-
114
-
115
-
116
-
117
-
118
-
119
-
120
-
121
-
122
-
123
-
124
-
125
-
126
-
127
-
128
-
129
-
130
-
131
-
132
-
133
-
134
-
135
-
136
-
137
-
138
-
139
-
140
-
141
-
142
-
143
-
144
-
145
-
146
-
147
-
148
-
149
-
150
-
151
-
152
-
153
-
154
-
155
-
156
-
157
-
158
-
 159
159 -
 160
160 -
 161
161 -
 162
162 -
 163
163 -
 164
164 -
 165
165 -
 166
166 -
 167
167 -
 168
168 -
 169
169 -
 170
170 -
 171
171 -
 172
172 -
 173
173 -
 174
174 -
 175
175 -
 176
176 -
 177
177 -
 178
178 -
 179
179 -
180
-
181
-
182
-
183
-
184
-
185
 |
 |

Three-month periods ended
January 31 April 30 July 31 October 31
2008
Net revenue ................................... $28,467 $28,262 $28,032 $33,603
Cost of sales(1) ................................. 21,444(4) 21,205(4) 21,197(4) 25,853(4)
Research and development ........................ 898 908 895 842
Selling, general and administrative ................... 3,296(4) 3,331(4) 3,193(4) 3,506(4)
Amortization of purchased intangible assets ............ 206 211 213 337
In-process research and development charges ........... — 13 — 32
Restructuring charges ............................ 10 4 5 251
Acquisition-related charges ........................ — — — 41
Total costs and expenses .......................... 25,854 25,672 25,503 30,862
Earnings from operations ......................... 2,613 2,590 2,529 2,741
Interest and other, net ............................ 72 3 23 (98)
Earnings before taxes ............................ 2,685 2,593 2,552 2,643
Provision for taxes ............................... 552 536 525 531
Net earnings ................................... $ 2,133 $ 2,057 $ 2,027 $ 2,112
Net earnings per share:(2)
Basic ....................................... $ 0.83 $ 0.83 $ 0.82 $ 0.87
Diluted ..................................... $ 0.80 $ 0.80 $ 0.80 $ 0.84
Cash dividends paid per share ...................... $ 0.08 $ 0.08 $ 0.08 $ 0.08
Range of per share stock prices on the New York Stock
Exchange
Low ....................................... $ 39.99 $ 40.16 $ 40.83 $ 30.03
High ....................................... $ 53.48 $ 49.69 $ 49.97 $ 49.20
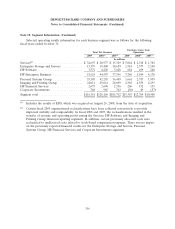
(1) Cost of products, cost of services and financing interest.
(2) EPS for each quarter is computed using the weighted-average number of shares outstanding during
that quarter, while EPS for the fiscal year is computed using the weighted-average number of
shares outstanding during the year. Thus, the sum of the EPS for each of the four quarters may
not equal the EPS for the fiscal year.
(3) As a result of the adoption of ASU 2009-13 and ASU 2009-14, fourth quarter net revenue and net
earnings were higher by $82 million and $19 million, respectively.
(4) Certain pursuit-related costs previously reported as Cost of sales have been realigned retroactively
to Selling, general and administrative expenses due to organizational realignments.
162