HP 2009 Annual Report Download - page 70
Download and view the complete annual report
Please find page 70 of the 2009 HP annual report below. You can navigate through the pages in the report by either clicking on the pages listed below, or by using the keyword search tool below to find specific information within the annual report.-
 1
1 -
2
-
3
-
4
-
5
-
6
-
7
-
8
-
9
-
10
-
11
-
12
-
13
-
14
-
15
-
16
-
17
-
18
-
19
-
20
-
21
-
22
-
23
-
24
-
25
-
26
-
27
-
28
-
29
-
30
-
31
-
32
-
33
-
34
-
35
-
36
-
37
-
38
-
39
-
40
-
41
-
42
-
43
-
44
-
45
-
46
-
47
-
48
-
49
-
50
-
51
-
52
-
53
-
54
-
55
-
56
-
57
-
58
-
59
-
 60
60 -
 61
61 -
 62
62 -
 63
63 -
 64
64 -
 65
65 -
 66
66 -
 67
67 -
 68
68 -
 69
69 -
 70
70 -
 71
71 -
 72
72 -
 73
73 -
 74
74 -
 75
75 -
 76
76 -
 77
77 -
 78
78 -
 79
79 -
 80
80 -
81
-
82
-
83
-
84
-
85
-
86
-
87
-
88
-
89
-
90
-
91
-
92
-
93
-
94
-
95
-
96
-
97
-
98
-
99
-
100
-
101
-
102
-
103
-
104
-
105
-
106
-
107
-
108
-
109
-
110
-
111
-
112
-
113
-
114
-
115
-
116
-
117
-
118
-
119
-
120
-
121
-
122
-
123
-
124
-
125
-
126
-
127
-
128
-
129
-
130
-
131
-
132
-
133
-
134
-
135
-
136
-
137
-
138
-
139
-
140
-
141
-
142
-
143
-
144
-
145
-
146
-
147
-
148
-
149
-
150
-
151
-
152
-
153
-
154
-
155
-
156
-
157
-
158
-
159
-
160
-
161
-
162
-
163
-
164
-
165
-
166
-
167
-
168
-
169
-
170
-
171
-
172
-
173
-
174
-
175
-
176
-
177
-
178
-
179
-
180
-
181
-
182
-
183
-
184
-
185
 |
 |

HEWLETT-PACKARD COMPANY AND SUBSIDIARIES
Management’s Discussion and Analysis of
Financial Condition and Results of Operations (Continued)
4% decline in consumer client ASPs. ASPs declined from fiscal 2007 as a result of price erosion related
to component cost reductions and a competitive pricing environment, the effect of which was partially
offset by an increased notebook mix and improved attach rates for monitors and other options.
PSG earnings from operations as a percentage of net revenue increased by 0.3 percentage points in
fiscal 2008 from fiscal 2007 as a result of a decrease in operating expenses as a percentage of net
revenue combined with a flat gross margin. Gross margin performance was a result of declining ASPs
offset by an increase in the attach rate of higher-margin options. The operating expense decline as a
percentage of net revenue in fiscal 2008 was the result primarily of the increased net revenue and
continued efforts to improve our cost structure through efficiency measures.
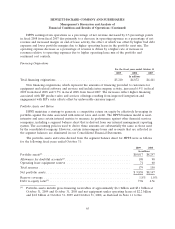
Imaging and Printing Group
For the fiscal years ended October 31
2009 2008 2007
In millions
Net revenue .......................................... $24,011 $29,614 $28,609
Earnings from operations ................................ $ 4,310 $ 4,559 $ 4,293
Earnings from operations as a % of net revenue ............... 18.0% 15.4% 15.0%
The components of the weighted net revenue change as compared to the prior-year periods by
business unit were as follows for the following fiscal years ended October 31:
2009 2008
Percentage Points
Commercial hardware ............................................... (8.9) 0.2
Supplies ......................................................... (6.6) 5.1
Consumer hardware ................................................. (3.4) (1.8)
Total IPG ........................................................ (18.9) 3.5
IPG net revenue decreased 18.9% (16.5% when adjusted for currency) in fiscal 2009 from fiscal
2008, reflecting the impact of the global economic slowdown. Net revenue for commercial hardware
declined 36% in fiscal 2009 as compared to fiscal 2008. The net revenue decline in commercial
hardware was driven by a unit volume decline of 38% in fiscal 2009 from fiscal 2008, due primarily to
worldwide market weaknesses impacting both our laser and our graphics businesses. Supplies net
revenue declined 11% in fiscal 2009 as compared to fiscal 2008. The supplies net revenue decline in
fiscal 2009 was across all platforms and was the result of reductions in channel inventory and
unfavorable currency impacts, the effect of which was partially moderated by supplies pricing. Net
revenue for consumer hardware declined 27% in fiscal 2009 as compared to fiscal 2008. The net
revenue decline in consumer hardware was driven by a unit volume decline of 24% in fiscal 2009 from
fiscal 2008, reflecting the weak demand environment and channel inventory reductions.
IPG earnings from operations as a percentage of net revenue increased 2.6 percentage points in
fiscal 2009 as compared to fiscal 2008. Operating margin improvement in fiscal 2009 was a combination
of an increase in gross margin and a decrease in operating expenses as a percentage of net revenue.
The improvement in gross margin in fiscal 2009 resulted primarily from an increase in the supplies mix
and supplies pricing, the effect of which was partially offset by hardware margin declines due to
63