HP 2009 Annual Report Download - page 184
Download and view the complete annual report
Please find page 184 of the 2009 HP annual report below. You can navigate through the pages in the report by either clicking on the pages listed below, or by using the keyword search tool below to find specific information within the annual report.-
 1
1 -
2
-
3
-
4
-
5
-
6
-
7
-
8
-
9
-
10
-
11
-
12
-
13
-
14
-
15
-
16
-
17
-
18
-
19
-
20
-
21
-
22
-
23
-
24
-
25
-
26
-
27
-
28
-
29
-
30
-
31
-
32
-
33
-
34
-
35
-
36
-
37
-
38
-
39
-
40
-
41
-
42
-
43
-
44
-
45
-
46
-
47
-
48
-
49
-
50
-
51
-
52
-
53
-
54
-
55
-
56
-
57
-
58
-
59
-
60
-
61
-
62
-
63
-
64
-
65
-
66
-
67
-
68
-
69
-
70
-
71
-
72
-
73
-
74
-
75
-
76
-
77
-
78
-
79
-
80
-
81
-
82
-
83
-
84
-
85
-
86
-
87
-
88
-
89
-
90
-
91
-
92
-
93
-
94
-
95
-
96
-
97
-
98
-
99
-
100
-
101
-
102
-
103
-
104
-
105
-
106
-
107
-
108
-
109
-
110
-
111
-
112
-
113
-
114
-
115
-
116
-
117
-
118
-
119
-
120
-
121
-
122
-
123
-
124
-
125
-
126
-
127
-
128
-
129
-
130
-
131
-
132
-
133
-
134
-
135
-
136
-
137
-
138
-
139
-
140
-
141
-
142
-
143
-
144
-
145
-
146
-
147
-
148
-
149
-
150
-
151
-
152
-
153
-
154
-
155
-
156
-
157
-
158
-
159
-
160
-
161
-
162
-
163
-
164
-
165
-
166
-
167
-
168
-
169
-
170
-
171
-
172
-
173
-
 174
174 -
 175
175 -
 176
176 -
 177
177 -
 178
178 -
 179
179 -
 180
180 -
 181
181 -
 182
182 -
 183
183 -
 184
184 -
 185
185
 |
 |

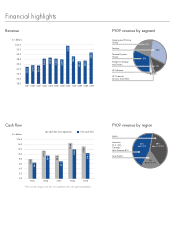
Financial highlights
$16.0
14.0
12.0
10.0
8.0
6.0
4.0
2.0
0.0
Cash flow
1 Free cash flow equals cash flow from operations less net capital expenditures.
FY05 FY06 FY07 FY08 FY09
$8.0
$6.6
$11.4
$9.4
$9.6
$7.1
$14.6
$13.4
$12.0
$10.2
$inbillions
Cash flow from operations Free cash flow1
FY09 revenue by region
EMEA
Americas
(U.S.36%,
Canada/
LatinAmerica8%)
Asia Pacific
44%
(up 6% Y/Y)
39%
(down 11% Y/Y)
17%
(down 7% Y/Y)
Revenue
1Q072Q073Q074Q071Q082Q083Q084Q081Q092Q093Q094Q09
$inbillions
$25.1
$25.5
$25.4
$28.3
$28.3
$28.8
$30.8
$28.5
$27.4
$27.6
$28.0
$33.6
$34.0
32.0
30.0
28.0
26.0
24.0
22.0
20.0
18.0
FY09 revenue by segment
Imaging and Printing
Group
Services
Personal Systems
Group
Enterprise Storage
and Servers
HP Software
HP Financial
Services and Other
21%
13%
31%
2%
3%
30%