HP 2009 Annual Report Download - page 47
Download and view the complete annual report
Please find page 47 of the 2009 HP annual report below. You can navigate through the pages in the report by either clicking on the pages listed below, or by using the keyword search tool below to find specific information within the annual report.-
 1
1 -
2
-
3
-
4
-
5
-
6
-
7
-
8
-
9
-
10
-
11
-
12
-
13
-
14
-
15
-
16
-
17
-
18
-
19
-
20
-
21
-
22
-
23
-
24
-
25
-
26
-
27
-
28
-
29
-
30
-
31
-
32
-
33
-
34
-
35
-
36
-
 37
37 -
 38
38 -
 39
39 -
 40
40 -
 41
41 -
 42
42 -
 43
43 -
 44
44 -
 45
45 -
 46
46 -
 47
47 -
 48
48 -
 49
49 -
 50
50 -
 51
51 -
 52
52 -
 53
53 -
 54
54 -
 55
55 -
 56
56 -
 57
57 -
58
-
59
-
60
-
61
-
62
-
63
-
64
-
65
-
66
-
67
-
68
-
69
-
70
-
71
-
72
-
73
-
74
-
75
-
76
-
77
-
78
-
79
-
80
-
81
-
82
-
83
-
84
-
85
-
86
-
87
-
88
-
89
-
90
-
91
-
92
-
93
-
94
-
95
-
96
-
97
-
98
-
99
-
100
-
101
-
102
-
103
-
104
-
105
-
106
-
107
-
108
-
109
-
110
-
111
-
112
-
113
-
114
-
115
-
116
-
117
-
118
-
119
-
120
-
121
-
122
-
123
-
124
-
125
-
126
-
127
-
128
-
129
-
130
-
131
-
132
-
133
-
134
-
135
-
136
-
137
-
138
-
139
-
140
-
141
-
142
-
143
-
144
-
145
-
146
-
147
-
148
-
149
-
150
-
151
-
152
-
153
-
154
-
155
-
156
-
157
-
158
-
159
-
160
-
161
-
162
-
163
-
164
-
165
-
166
-
167
-
168
-
169
-
170
-
171
-
172
-
173
-
174
-
175
-
176
-
177
-
178
-
179
-
180
-
181
-
182
-
183
-
184
-
185
 |
 |
HEWLETT-PACKARD COMPANY AND SUBSIDIARIES
Management’s Discussion and Analysis of
Financial Condition and Results of Operations (Continued)
(‘‘ASU 2009-13’’). The new standard changes the requirements for establishing separate units of
accounting in a multiple element arrangement and requires the allocation of arrangement consideration
to each deliverable based on the relative selling price. The selling price for each deliverable is based on
vendor-specific objective evidence (‘‘VSOE’’) if available, third-party evidence (‘‘TPE’’) if VSOE is not
available, or estimated selling price (‘‘ESP’’) if neither VSOE nor TPE is available.
Concurrently to issuing ASU 2009-13, the FASB also issued ASU No. 2009-14, ‘‘Certain Revenue
Arrangements That Include Software Elements’’ (‘‘ASU 2009-14’’). ASU 2009-14 excludes software that
is contained on a tangible product from the scope of software revenue guidance if the software is
essential to the tangible product’s functionality.
HP early adopted the provisions of ASU 2009-13 and ASU 2009-14 as of the beginning of fiscal
2009 for new and materially modified deals originating after November 1, 2008; therefore the
previously reported quarterly results have been restated to reflect the impact of adoption.
We establish VSOE of selling price using the price charged for a deliverable when sold separately
and, in rare instances, using the price established by management having the relevant authority. TPE of
selling price is established by evaluating largely similar and interchangeable competitor products or
services in standalone sales to similarly situated customers. The best estimate of selling price is
established considering internal factors such as margin objectives, pricing practices and controls,
customer segment pricing strategies and the product lifecycle. Consideration is also given to market
conditions such as competitor pricing strategies and industry technology lifecycles. When determining
our best estimate of selling price, we apply management judgment when establishing margin objectives
and pricing strategies and evaluating market conditions and product lifecycles. We may modify or
develop new go-to-market practices in the future. As these go-to-market strategies evolve, we may
modify our pricing practices in the future, which may result in changes in selling prices, impacting both
VSOE and ESP. The aforementioned factors may result in a different allocation of revenue to the
deliverables in multiple element arrangements from the current fiscal year, which may change the
pattern and timing of revenue recognition for these elements but will not change the total revenue
recognized for the arrangement.
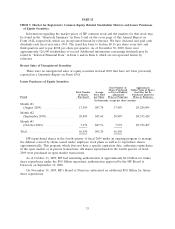
The adoption of ASU 2009-13 and ASU 2009-14 was not material to our financial results,
increasing net revenues and net earnings by $255 million and $55 million, respectively for fiscal 2009.
The primary driver of the impact was the number of new or materially modified deals, particularly
impacting the second half of the fiscal year, which was driven by economic and customer-specific
factors. An additional driver of the impact was the extent of hardware or shorter-term service projects
sold into longer-term complex service arrangements in a particular quarter, which may vary significantly
on a deal-by-deal basis. We are not able to reasonably estimate the effect of adopting these standards
on future financial periods as the impact will vary based on the nature and volume of new or materially
modified deals in any given period.
Business Combinations
We allocate the purchase price of acquired companies to the tangible assets acquired, liabilities
assumed and intangible assets acquired, including in-process research and development (‘‘IPR&D’’),
based on their estimated fair values. The excess of the purchase price over these fair values is recorded
as goodwill. We engage independent third-party appraisal firms to assist us in determining the fair
values of assets acquired and liabilities assumed. Such valuations require management to make
significant estimates and assumptions, especially with respect to intangible assets. The significant
40