HP 2009 Annual Report Download - page 165
Download and view the complete annual report
Please find page 165 of the 2009 HP annual report below. You can navigate through the pages in the report by either clicking on the pages listed below, or by using the keyword search tool below to find specific information within the annual report.-
 1
1 -
2
-
3
-
4
-
5
-
6
-
7
-
8
-
9
-
10
-
11
-
12
-
13
-
14
-
15
-
16
-
17
-
18
-
19
-
20
-
21
-
22
-
23
-
24
-
25
-
26
-
27
-
28
-
29
-
30
-
31
-
32
-
33
-
34
-
35
-
36
-
37
-
38
-
39
-
40
-
41
-
42
-
43
-
44
-
45
-
46
-
47
-
48
-
49
-
50
-
51
-
52
-
53
-
54
-
55
-
56
-
57
-
58
-
59
-
60
-
61
-
62
-
63
-
64
-
65
-
66
-
67
-
68
-
69
-
70
-
71
-
72
-
73
-
74
-
75
-
76
-
77
-
78
-
79
-
80
-
81
-
82
-
83
-
84
-
85
-
86
-
87
-
88
-
89
-
90
-
91
-
92
-
93
-
94
-
95
-
96
-
97
-
98
-
99
-
100
-
101
-
102
-
103
-
104
-
105
-
106
-
107
-
108
-
109
-
110
-
111
-
112
-
113
-
114
-
115
-
116
-
117
-
118
-
119
-
120
-
121
-
122
-
123
-
124
-
125
-
126
-
127
-
128
-
129
-
130
-
131
-
132
-
133
-
134
-
135
-
136
-
137
-
138
-
139
-
140
-
141
-
142
-
143
-
144
-
145
-
146
-
147
-
148
-
149
-
150
-
151
-
152
-
153
-
154
-
 155
155 -
 156
156 -
 157
157 -
 158
158 -
 159
159 -
 160
160 -
 161
161 -
 162
162 -
 163
163 -
 164
164 -
 165
165 -
 166
166 -
 167
167 -
 168
168 -
 169
169 -
 170
170 -
 171
171 -
 172
172 -
 173
173 -
 174
174 -
 175
175 -
176
-
177
-
178
-
179
-
180
-
181
-
182
-
183
-
184
-
185
 |
 |

HEWLETT-PACKARD COMPANY AND SUBSIDIARIES
Notes to Consolidated Financial Statements (Continued)
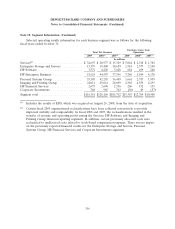
Note 19: Segment Information (Continued)
Major Customers
No single customer represented 10% or more of HP’s total net revenue in any fiscal year
presented.
Geographic Information
Net revenue, classified by the major geographic areas in which HP operates, was as follows for the
following fiscal years ended October 31:
2009 2008 2007
In millions
Net revenue:
U.S. .................................. $ 41,314 $ 36,932 $ 34,814
Non-U.S. ............................... 73,238 81,432 69,472
Total HP consolidated net revenue ............ $114,552 $118,364 $104,286
Net revenue by geographic area is based upon the sales location that predominately represents the
customer location. Other than the United States, no single country represented more than 10% of HP’s
total consolidated net revenue in any period presented. HP reports revenue net of sales taxes, use taxes
and value-added taxes directly imposed by governmental authorities on HP’s revenue producing
transactions with its customers.
At October 31, 2009 and 2008, Belgium and the United States had 10% or more of HP’s total
consolidated net assets. At October 31, 2007, no single country other than the United States had 10%
or more of HP’s total consolidated net assets.
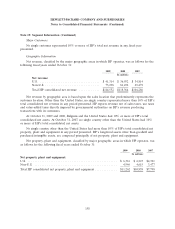
No single country other than the United States had more than 10% of HP’s total consolidated net
property, plant and equipment in any period presented. HP’s long-lived assets other than goodwill and
purchased intangible assets, are composed principally of net property, plant and equipment.
Net property, plant and equipment, classified by major geographic areas in which HP operates, was
as follows for the following fiscal years ended October 31:
2009 2008 2007
In millions
Net property, plant and equipment:
U.S. ................................................... $ 6,316 $ 6,223 $4,321
Non-U.S. ............................................... 4,946 4,615 3,477
Total HP consolidated net property, plant and equipment ............. $11,262 $10,838 $7,798
158