HP 2009 Annual Report Download - page 42
Download and view the complete annual report
Please find page 42 of the 2009 HP annual report below. You can navigate through the pages in the report by either clicking on the pages listed below, or by using the keyword search tool below to find specific information within the annual report.-
 1
1 -
2
-
3
-
4
-
5
-
6
-
7
-
8
-
9
-
10
-
11
-
12
-
13
-
14
-
15
-
16
-
17
-
18
-
19
-
20
-
21
-
22
-
23
-
24
-
25
-
26
-
27
-
28
-
29
-
30
-
31
-
 32
32 -
 33
33 -
 34
34 -
 35
35 -
 36
36 -
 37
37 -
 38
38 -
 39
39 -
 40
40 -
 41
41 -
 42
42 -
 43
43 -
 44
44 -
 45
45 -
 46
46 -
 47
47 -
 48
48 -
 49
49 -
 50
50 -
 51
51 -
 52
52 -
53
-
54
-
55
-
56
-
57
-
58
-
59
-
60
-
61
-
62
-
63
-
64
-
65
-
66
-
67
-
68
-
69
-
70
-
71
-
72
-
73
-
74
-
75
-
76
-
77
-
78
-
79
-
80
-
81
-
82
-
83
-
84
-
85
-
86
-
87
-
88
-
89
-
90
-
91
-
92
-
93
-
94
-
95
-
96
-
97
-
98
-
99
-
100
-
101
-
102
-
103
-
104
-
105
-
106
-
107
-
108
-
109
-
110
-
111
-
112
-
113
-
114
-
115
-
116
-
117
-
118
-
119
-
120
-
121
-
122
-
123
-
124
-
125
-
126
-
127
-
128
-
129
-
130
-
131
-
132
-
133
-
134
-
135
-
136
-
137
-
138
-
139
-
140
-
141
-
142
-
143
-
144
-
145
-
146
-
147
-
148
-
149
-
150
-
151
-
152
-
153
-
154
-
155
-
156
-
157
-
158
-
159
-
160
-
161
-
162
-
163
-
164
-
165
-
166
-
167
-
168
-
169
-
170
-
171
-
172
-
173
-
174
-
175
-
176
-
177
-
178
-
179
-
180
-
181
-
182
-
183
-
184
-
185
 |
 |

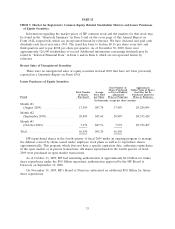
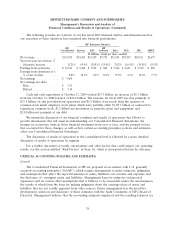
ITEM 6. Selected Financial Data.
The information set forth below is not necessarily indicative of results of future operations and
should be read in conjunction with Item 7, ‘‘Management’s Discussion and Analysis of Financial
Condition and Results of Operations,’’ and the Consolidated Financial Statements and notes thereto
included in Item 8, ‘‘Financial Statements and Supplementary Data,’’ of this Form 10-K, which are
incorporated herein by reference, in order to understand further the factors that may affect the
comparability of the financial data presented below.
HEWLETT-PACKARD COMPANY AND SUBSIDIARIES
Selected Financial Data
For the fiscal years ended October 31,
2009(2) 2008 2007 2006 2005
In millions, except per share amounts
Net revenue ........................... $114,552 $118,364 $104,286 $91,658 $86,696
Earnings from operations(1) ................ $ 10,136 $ 10,473 $ 8,719 $ 6,560 $ 3,473
Net earnings ........................... $ 7,660 $ 8,329 $ 7,264 $ 6,198 $ 2,398
Net earnings per share
Basic ............................... $ 3.21 $ 3.35 $ 2.76 $ 2.23 $ 0.83
Diluted ............................. $ 3.14 $ 3.25 $ 2.68 $ 2.18 $ 0.82
Cash dividends declared per share ........... $ 0.32 $ 0.32 $ 0.32 $ 0.32 $ 0.32
At year-end:
Total assets .......................... $114,799 $113,331 $ 88,699 $81,981 $77,317
Long-term debt ....................... $ 13,980 $ 7,676 $ 4,997 $ 2,490 $ 3,392
(1) Earnings from operations include the following items:
2009 2008 2007 2006 2005
In millions
Amortization of purchased intangible assets ......... $1,571 $ 967 $ 783 $ 604 $ 622
Restructuring charges ......................... 640 270 387 158 1,684
In-process research and development charges ........ 7 45 190 52 2
Pension curtailments and pension settlements, net . . . . — — (517) — (199)
Acquisition-related charges ..................... 242 41 — — —
Total charges before taxes ...................... $2,460 $1,323 $ 843 $ 814 $2,109
Total charges, net of taxes ...................... $1,733 $ 973 $ 690 $ 604 $1,509
(2) In the fourth quarter of fiscal 2009, HP early adopted Financial Accounting Standards Board
(‘‘FASB’’) Accounting Standards Update (‘‘ASU’’) No. 2009-13, ‘‘Multiple-Deliverable Revenue
Arrangements’’ and FASB ASU No. 2009-14, ‘‘Certain Revenue Arrangements That Include
Software Elements.’’ HP adopted these standards as of the beginning of fiscal 2009. As a result,
fiscal 2009 net revenues and net earnings were higher by $255 million and $55 million, respectively.
35